Convergent Fibonacci Levels Placed In Global Dictionary
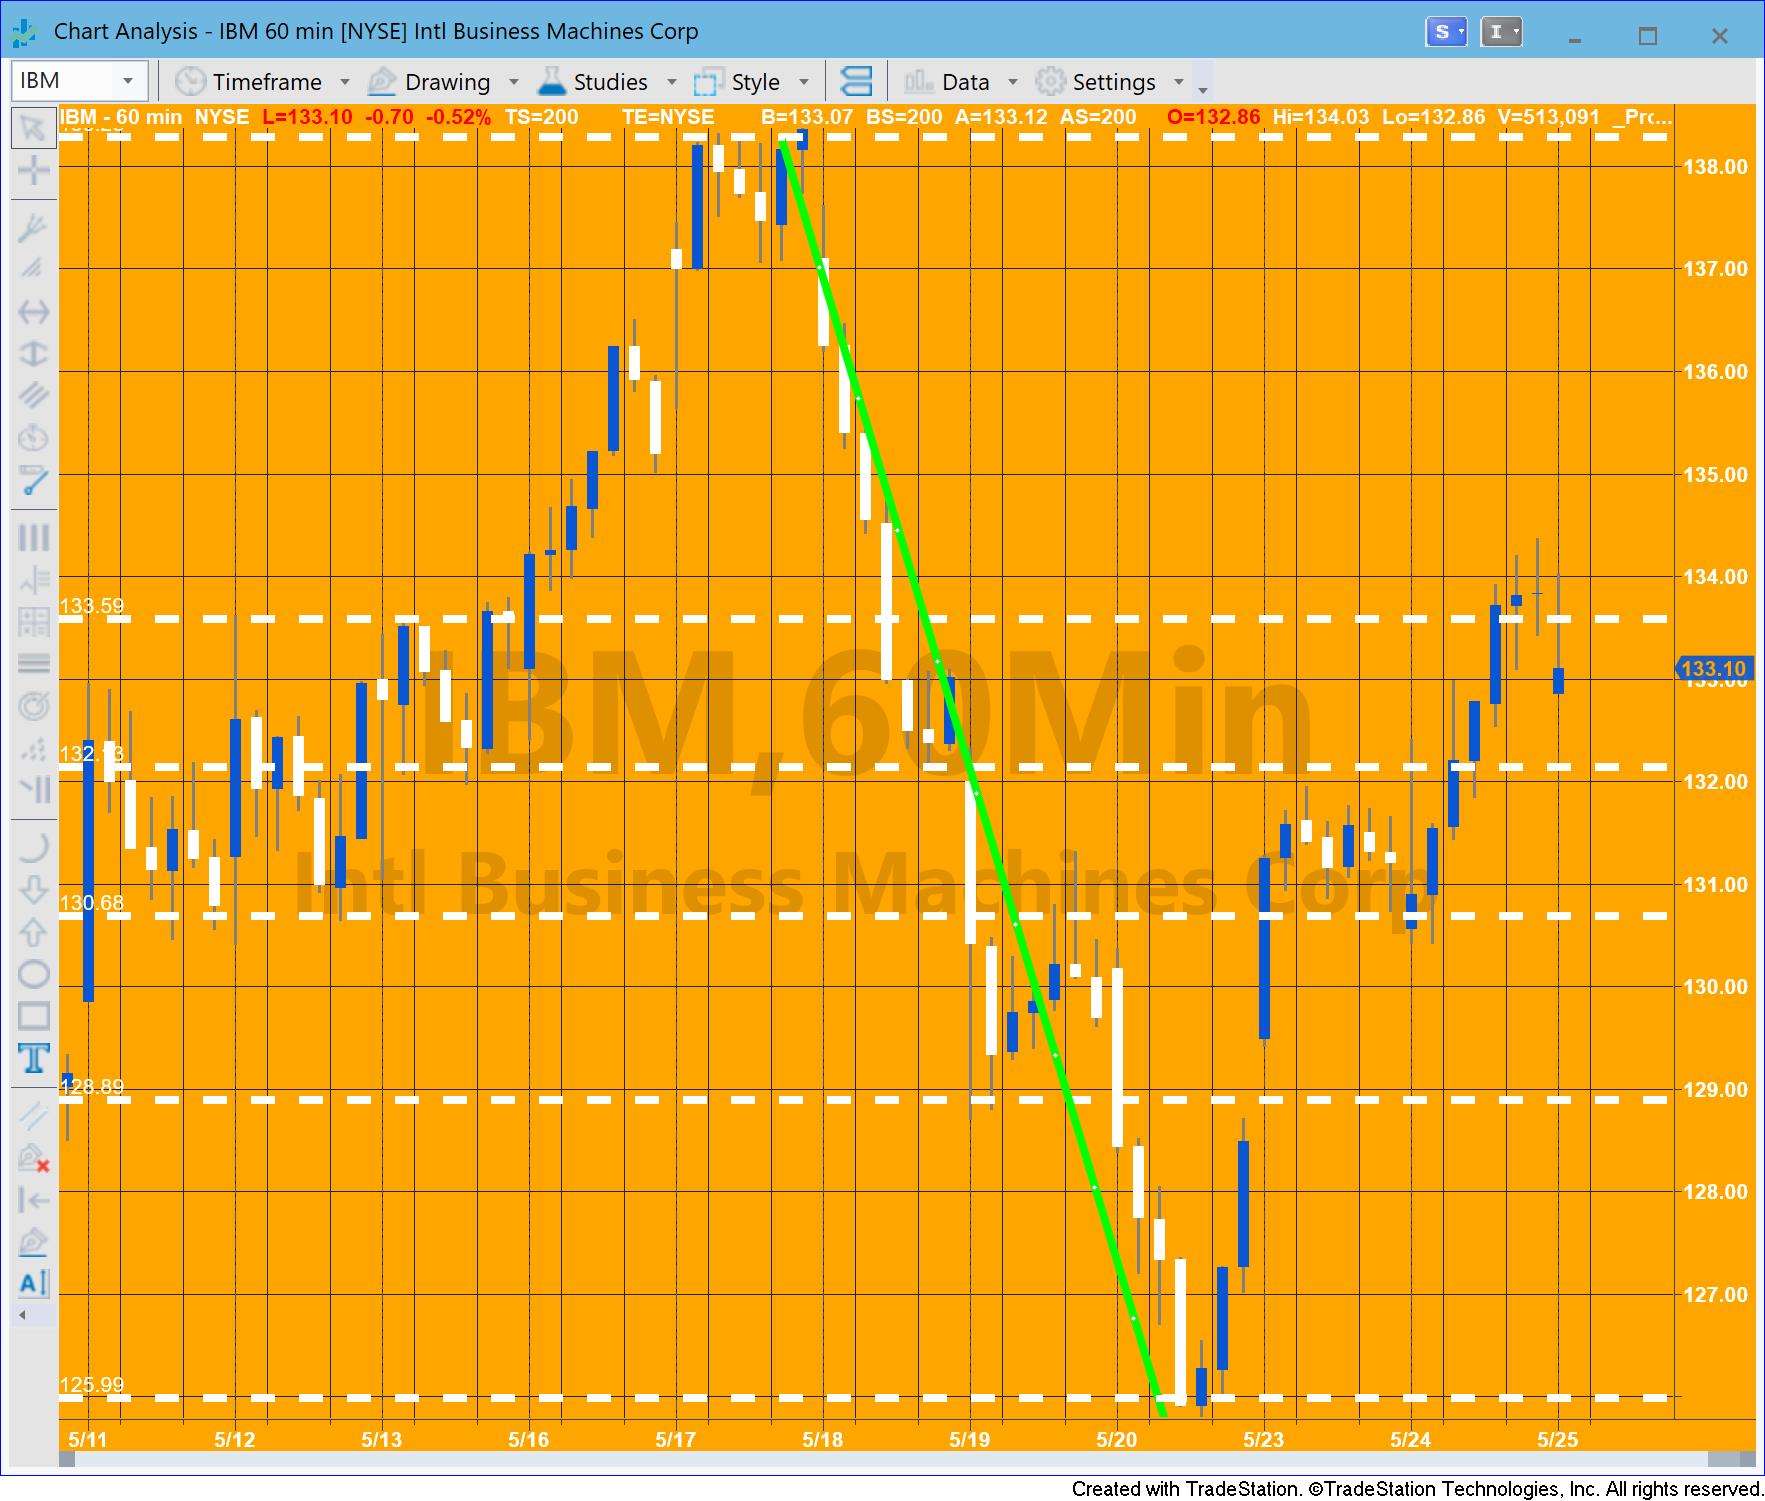
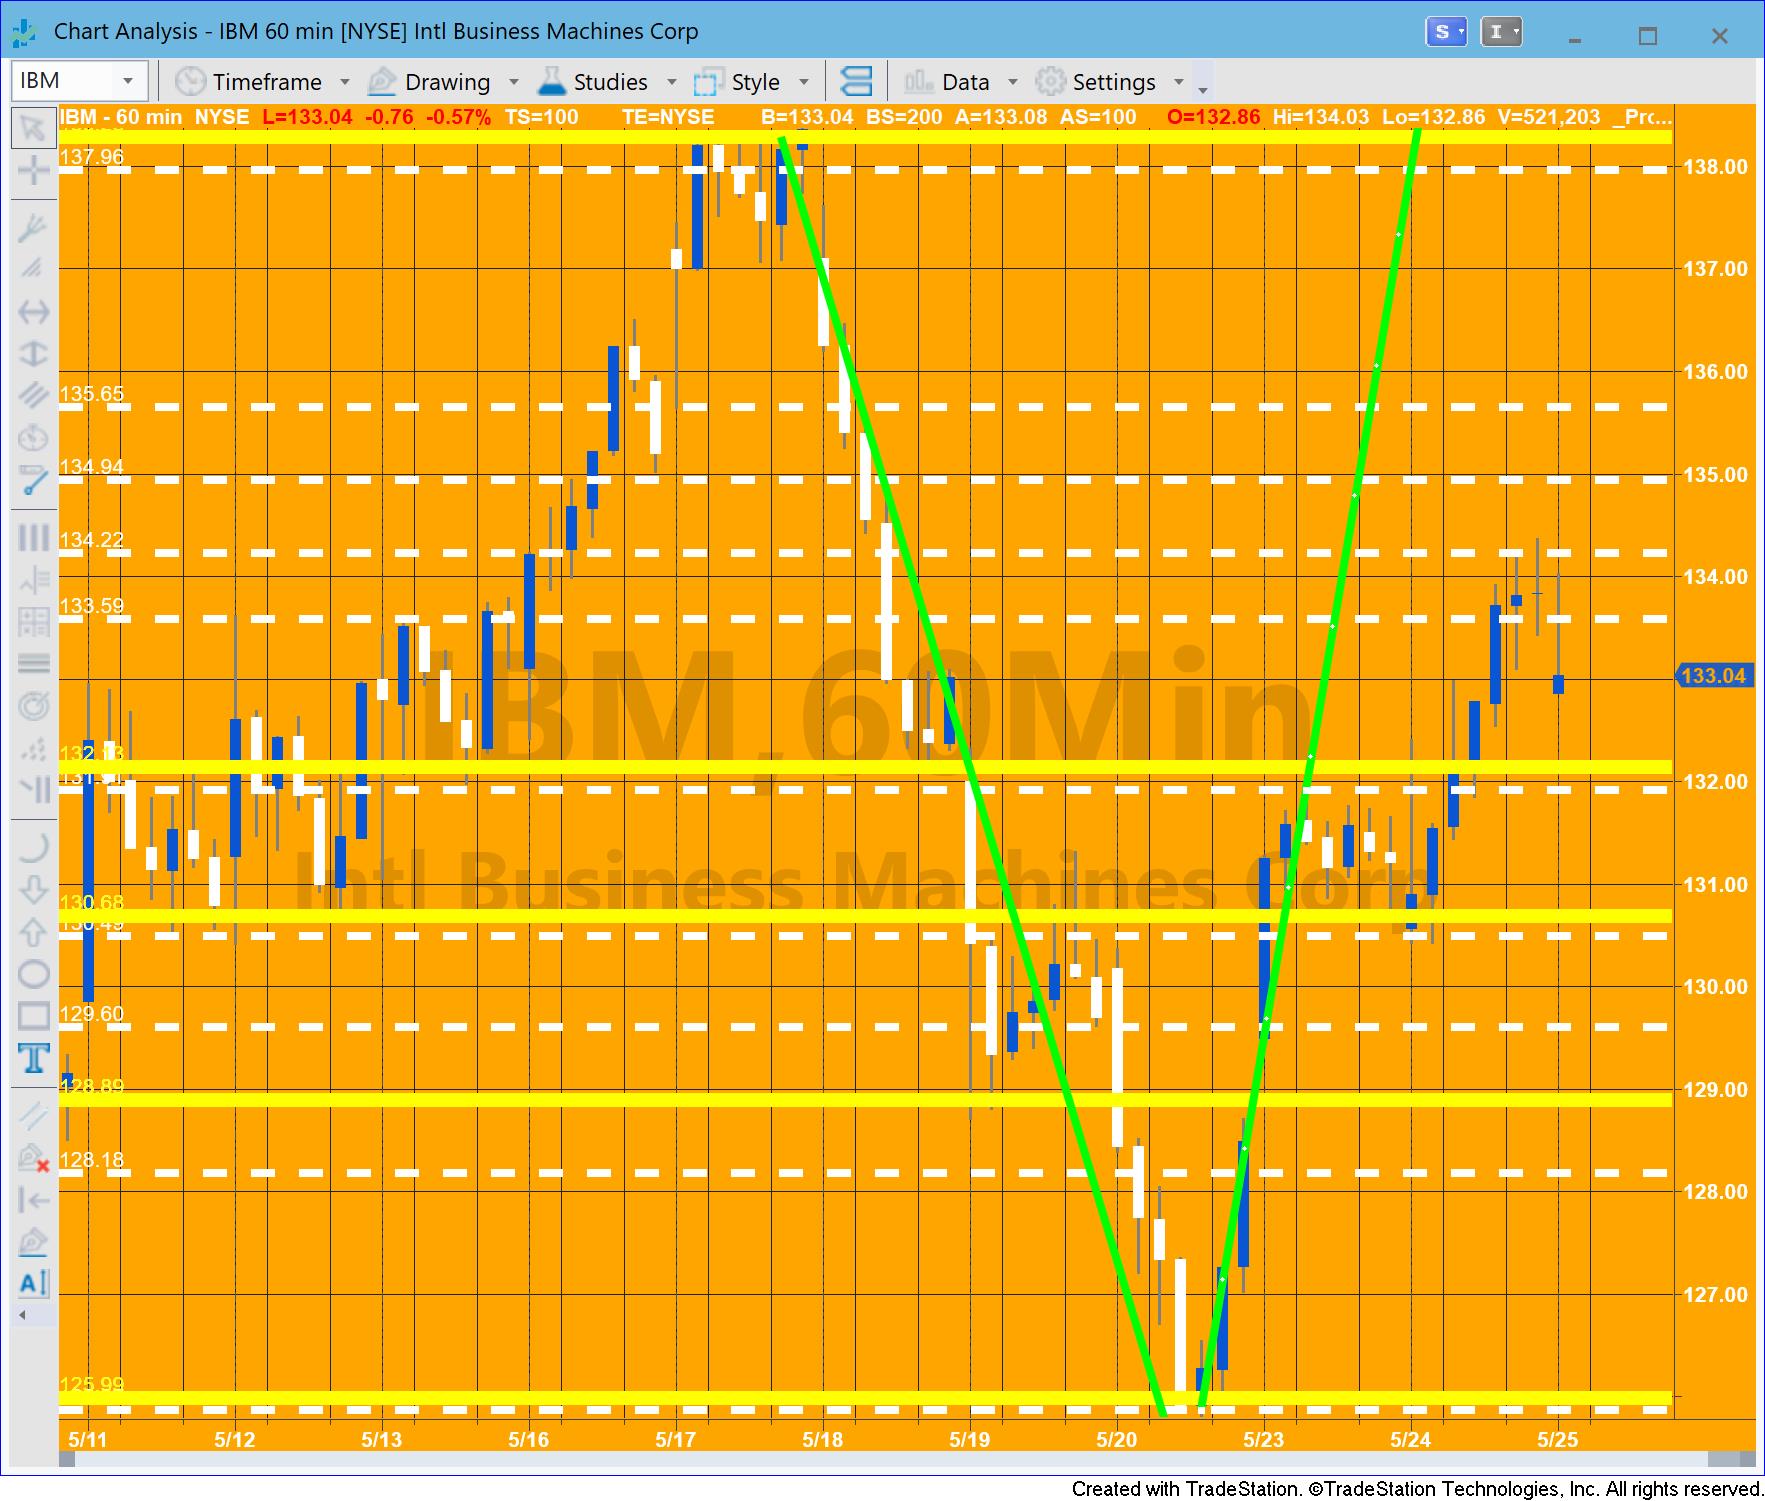
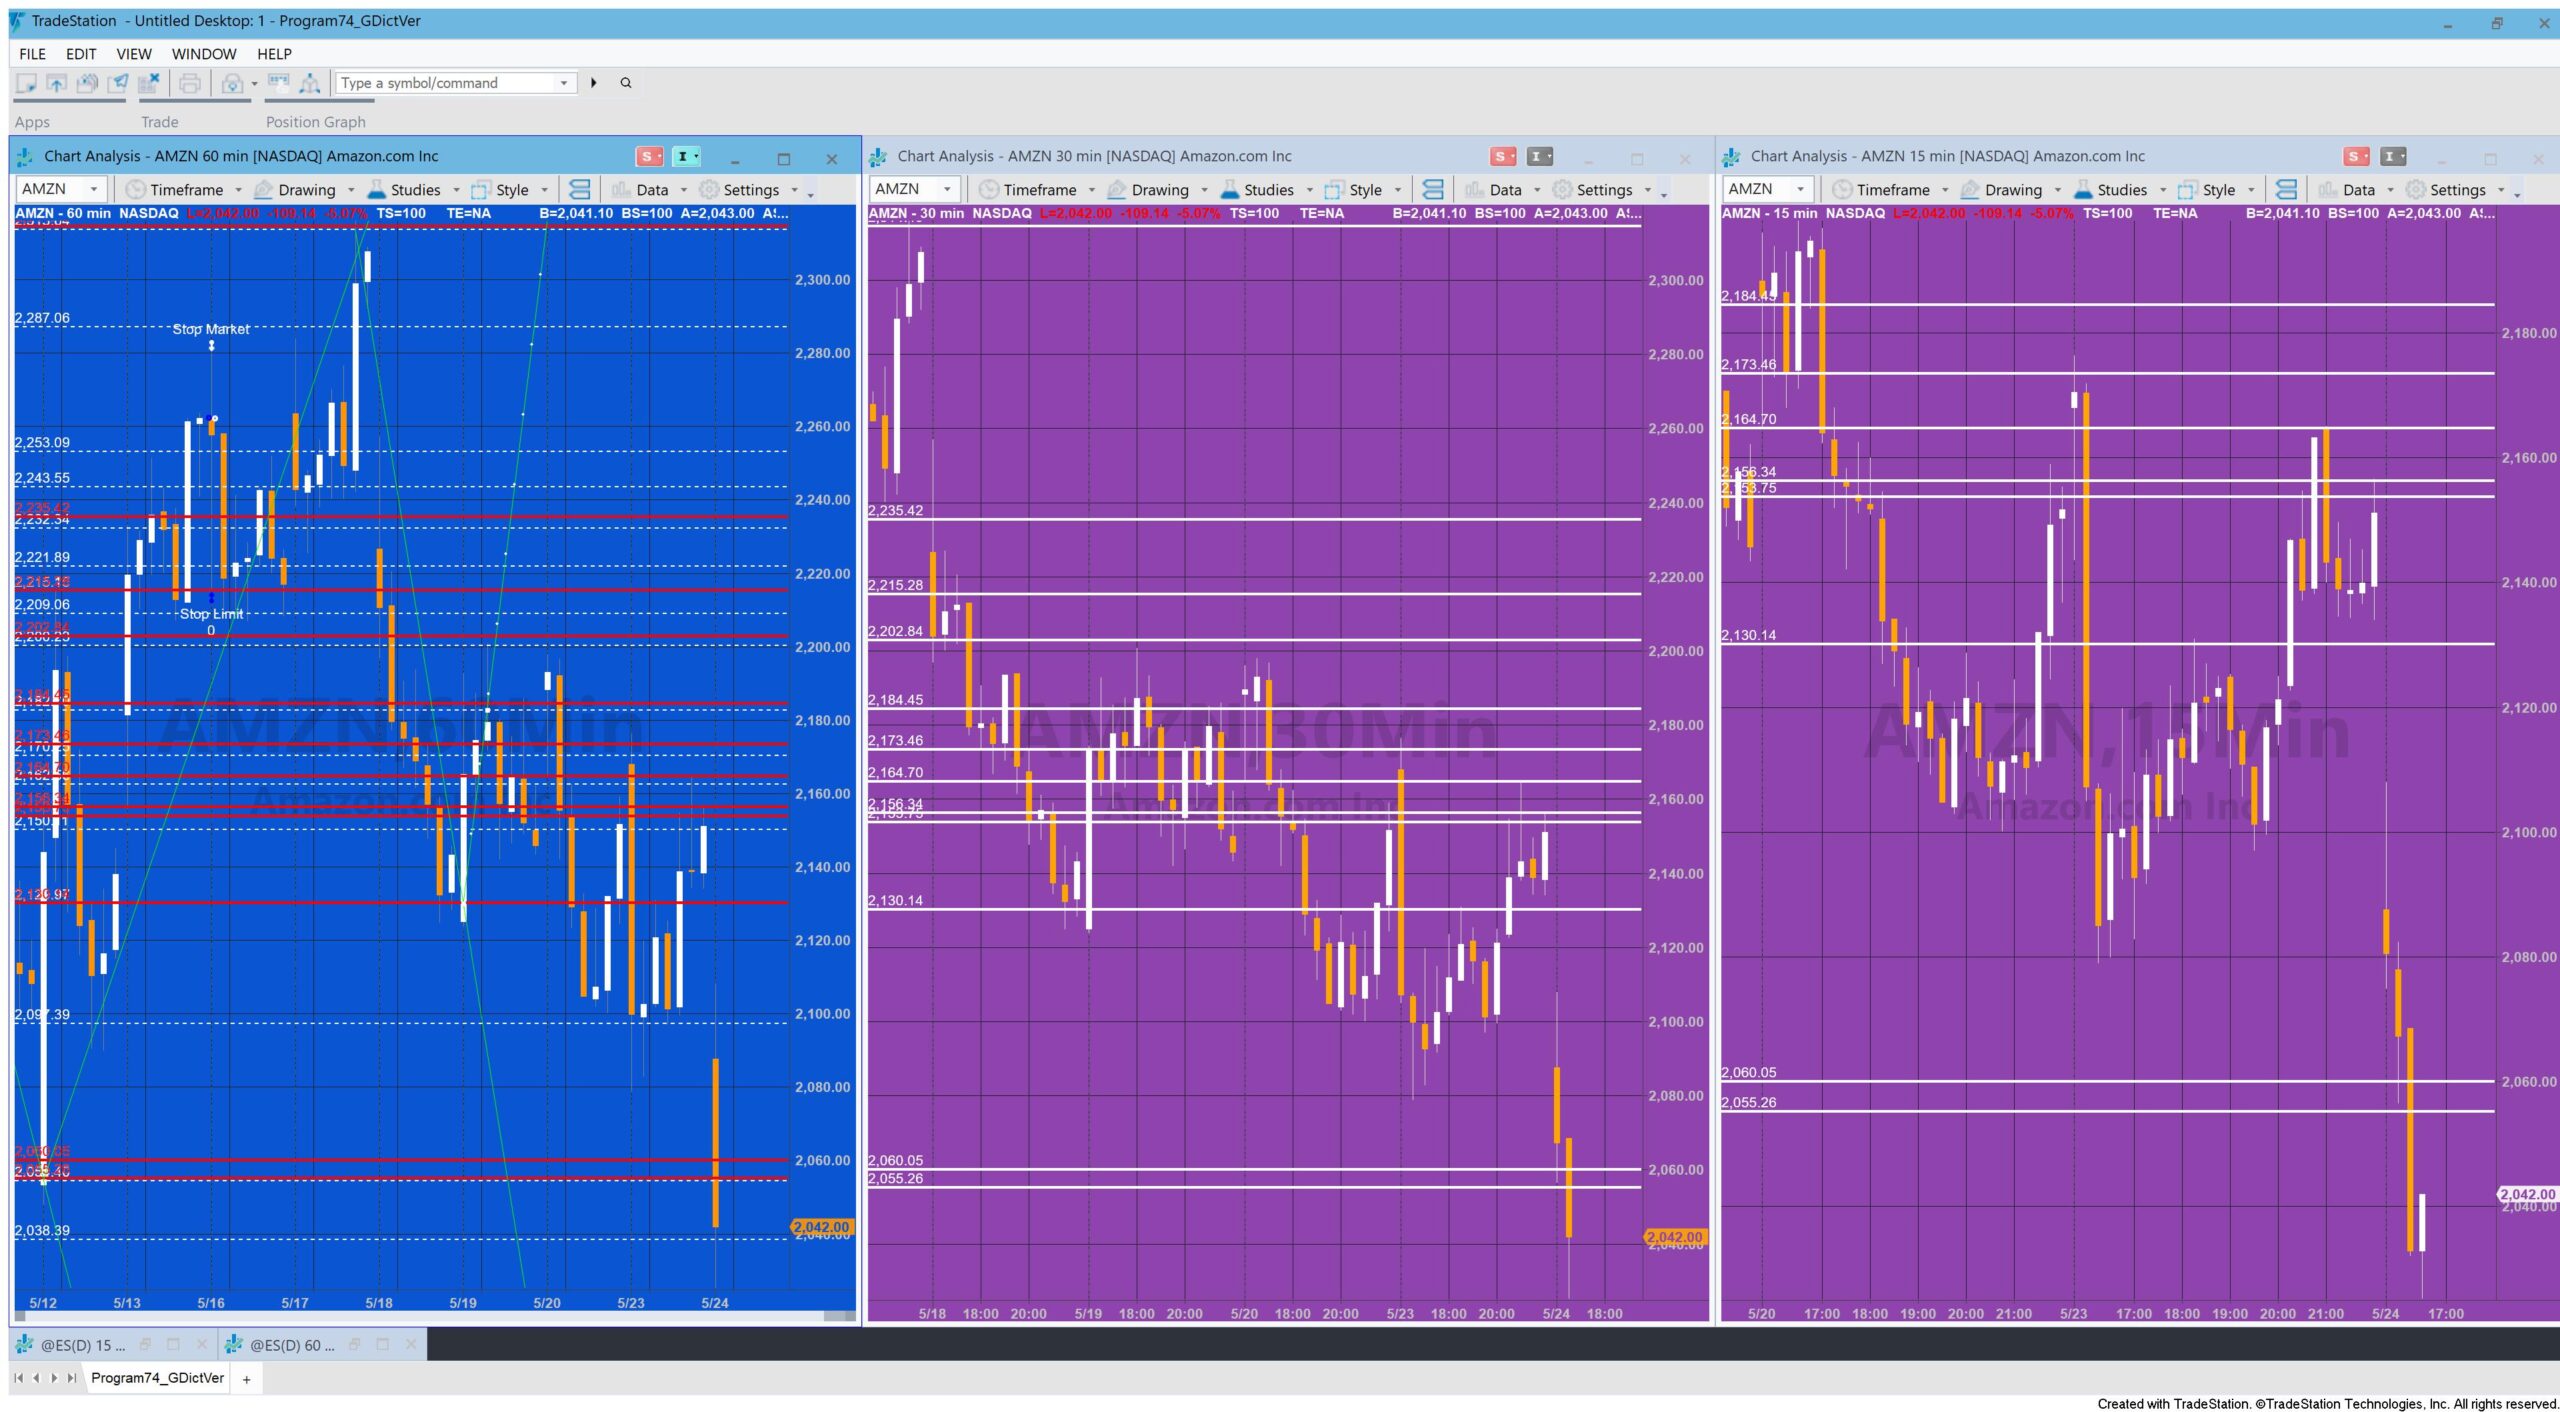
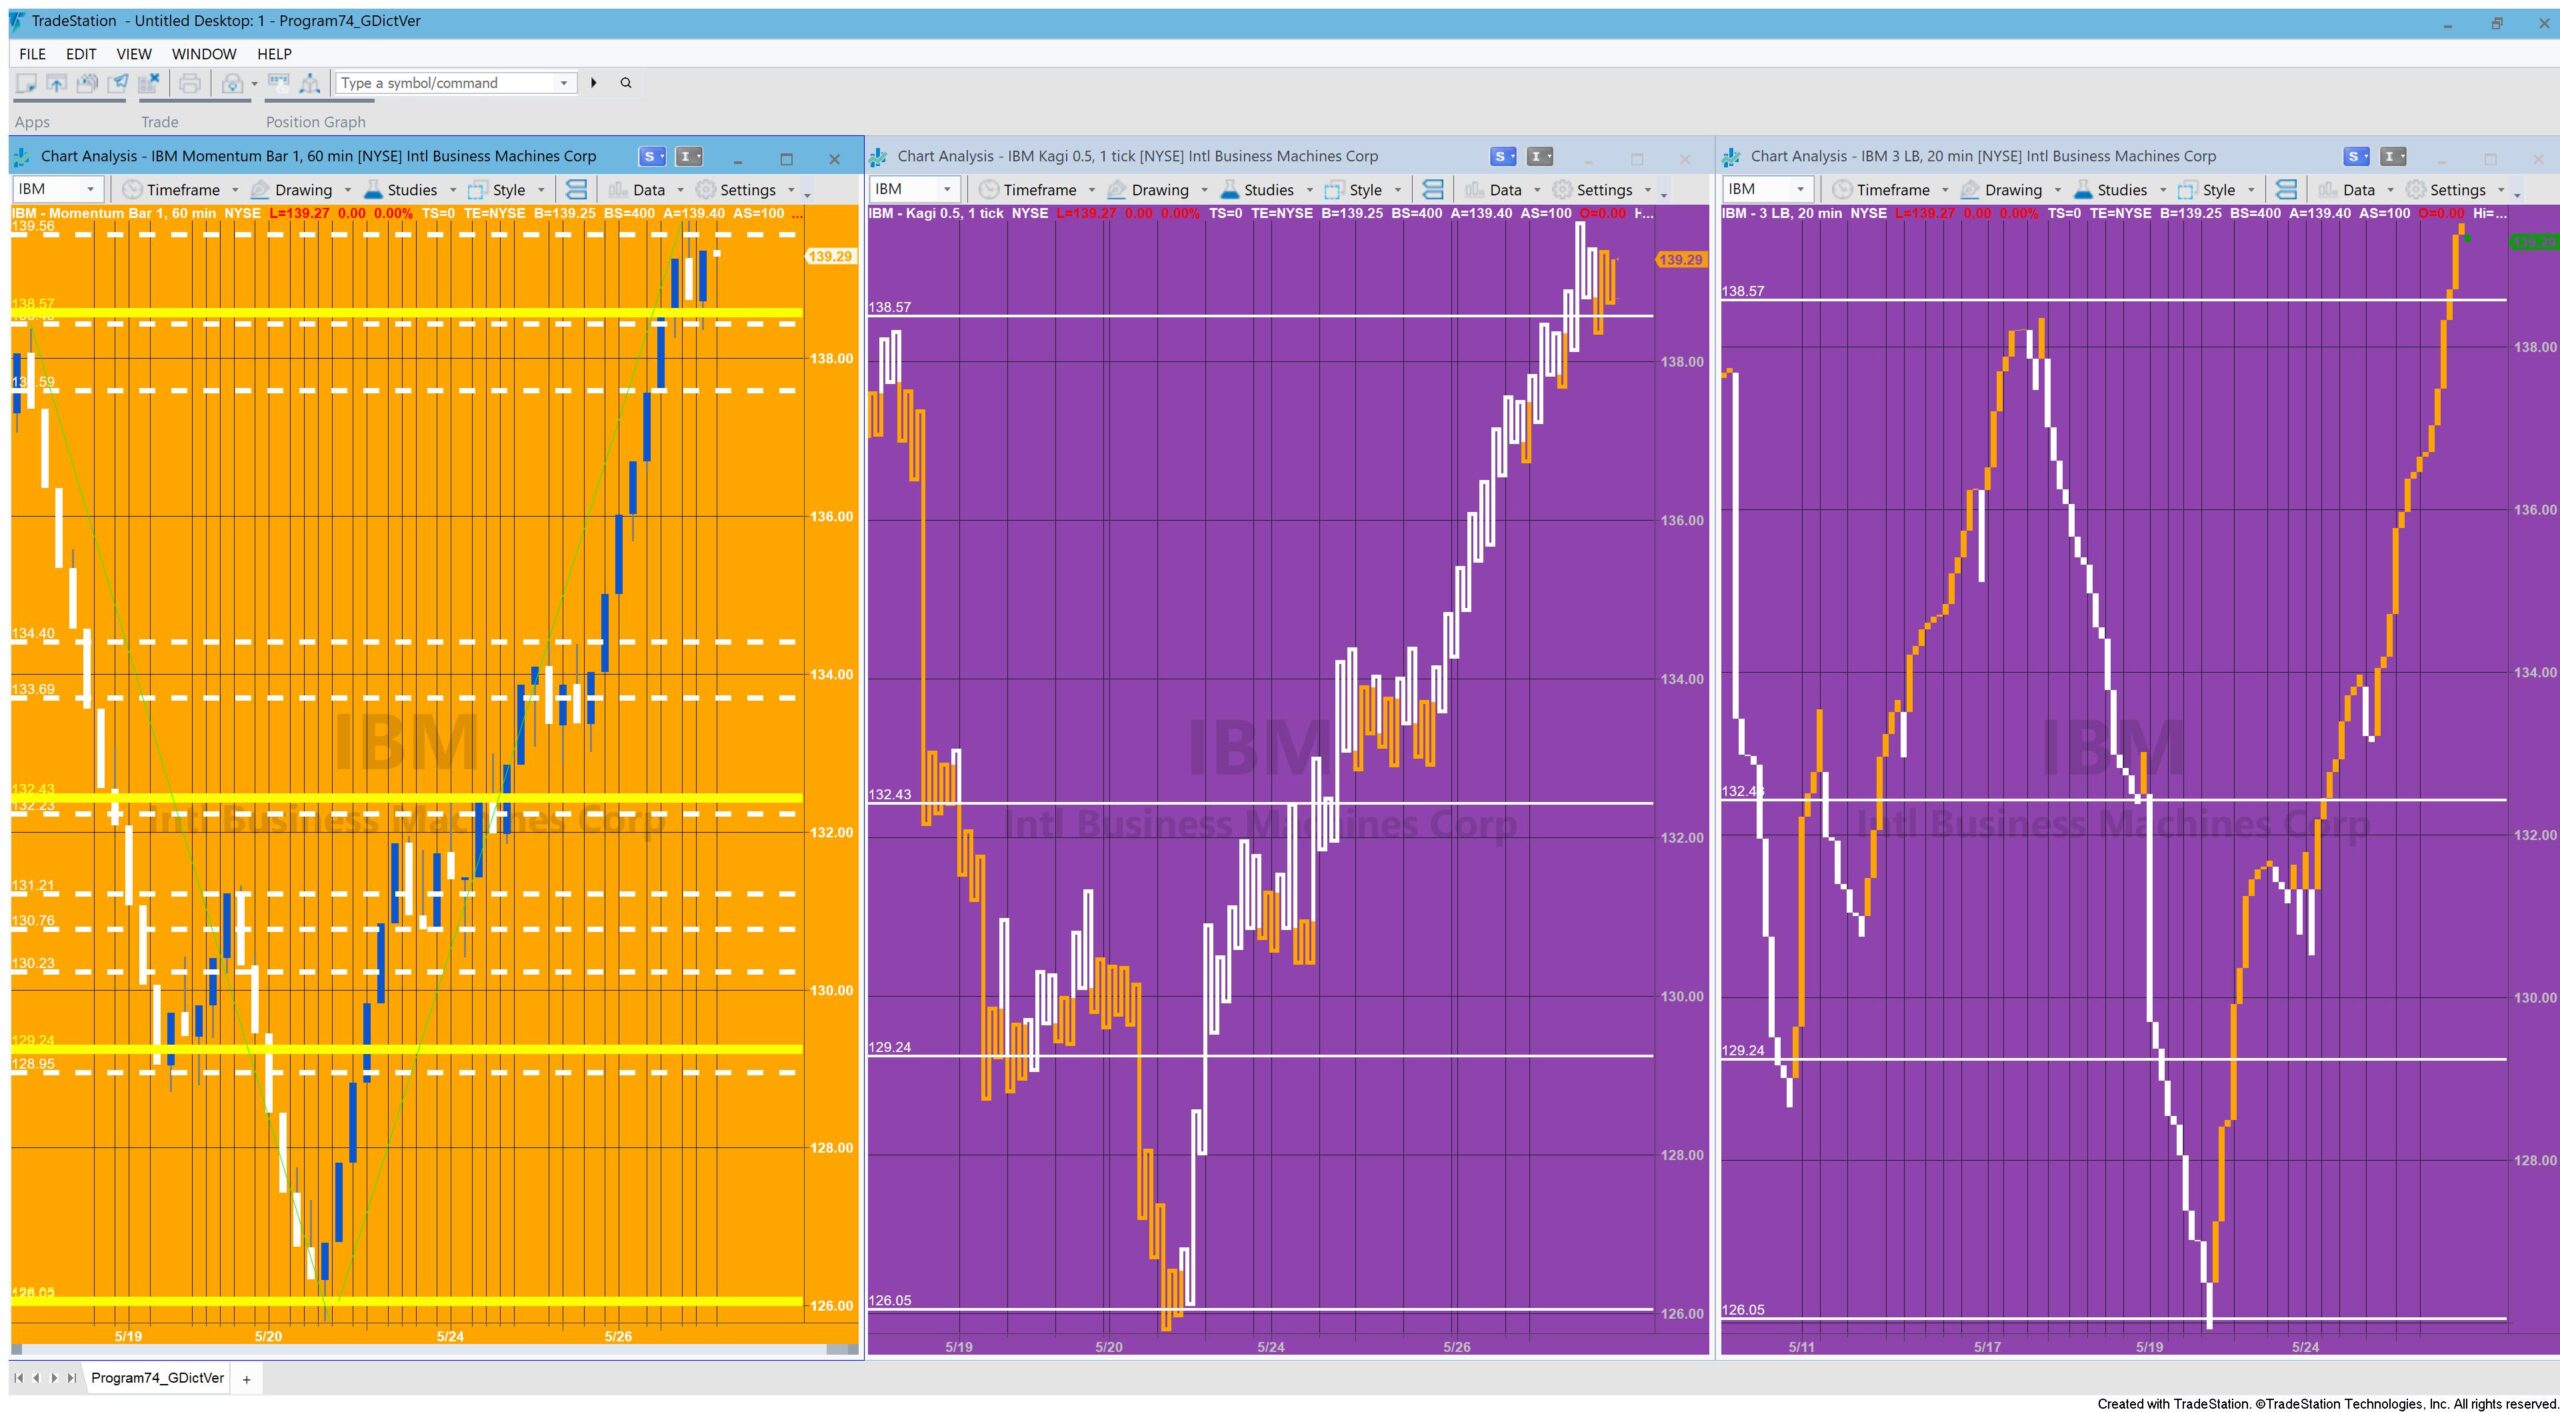
Program 74 GlobalDictionary Edition allows a user to draw trend lines on a chart with the drawing tools (the green line above), for which Fibonacci retracement levels are automatically calculated and drawn (the white dotted lines). This ‘sending’ program is a Show-me study named: _Program74_GDictVer.
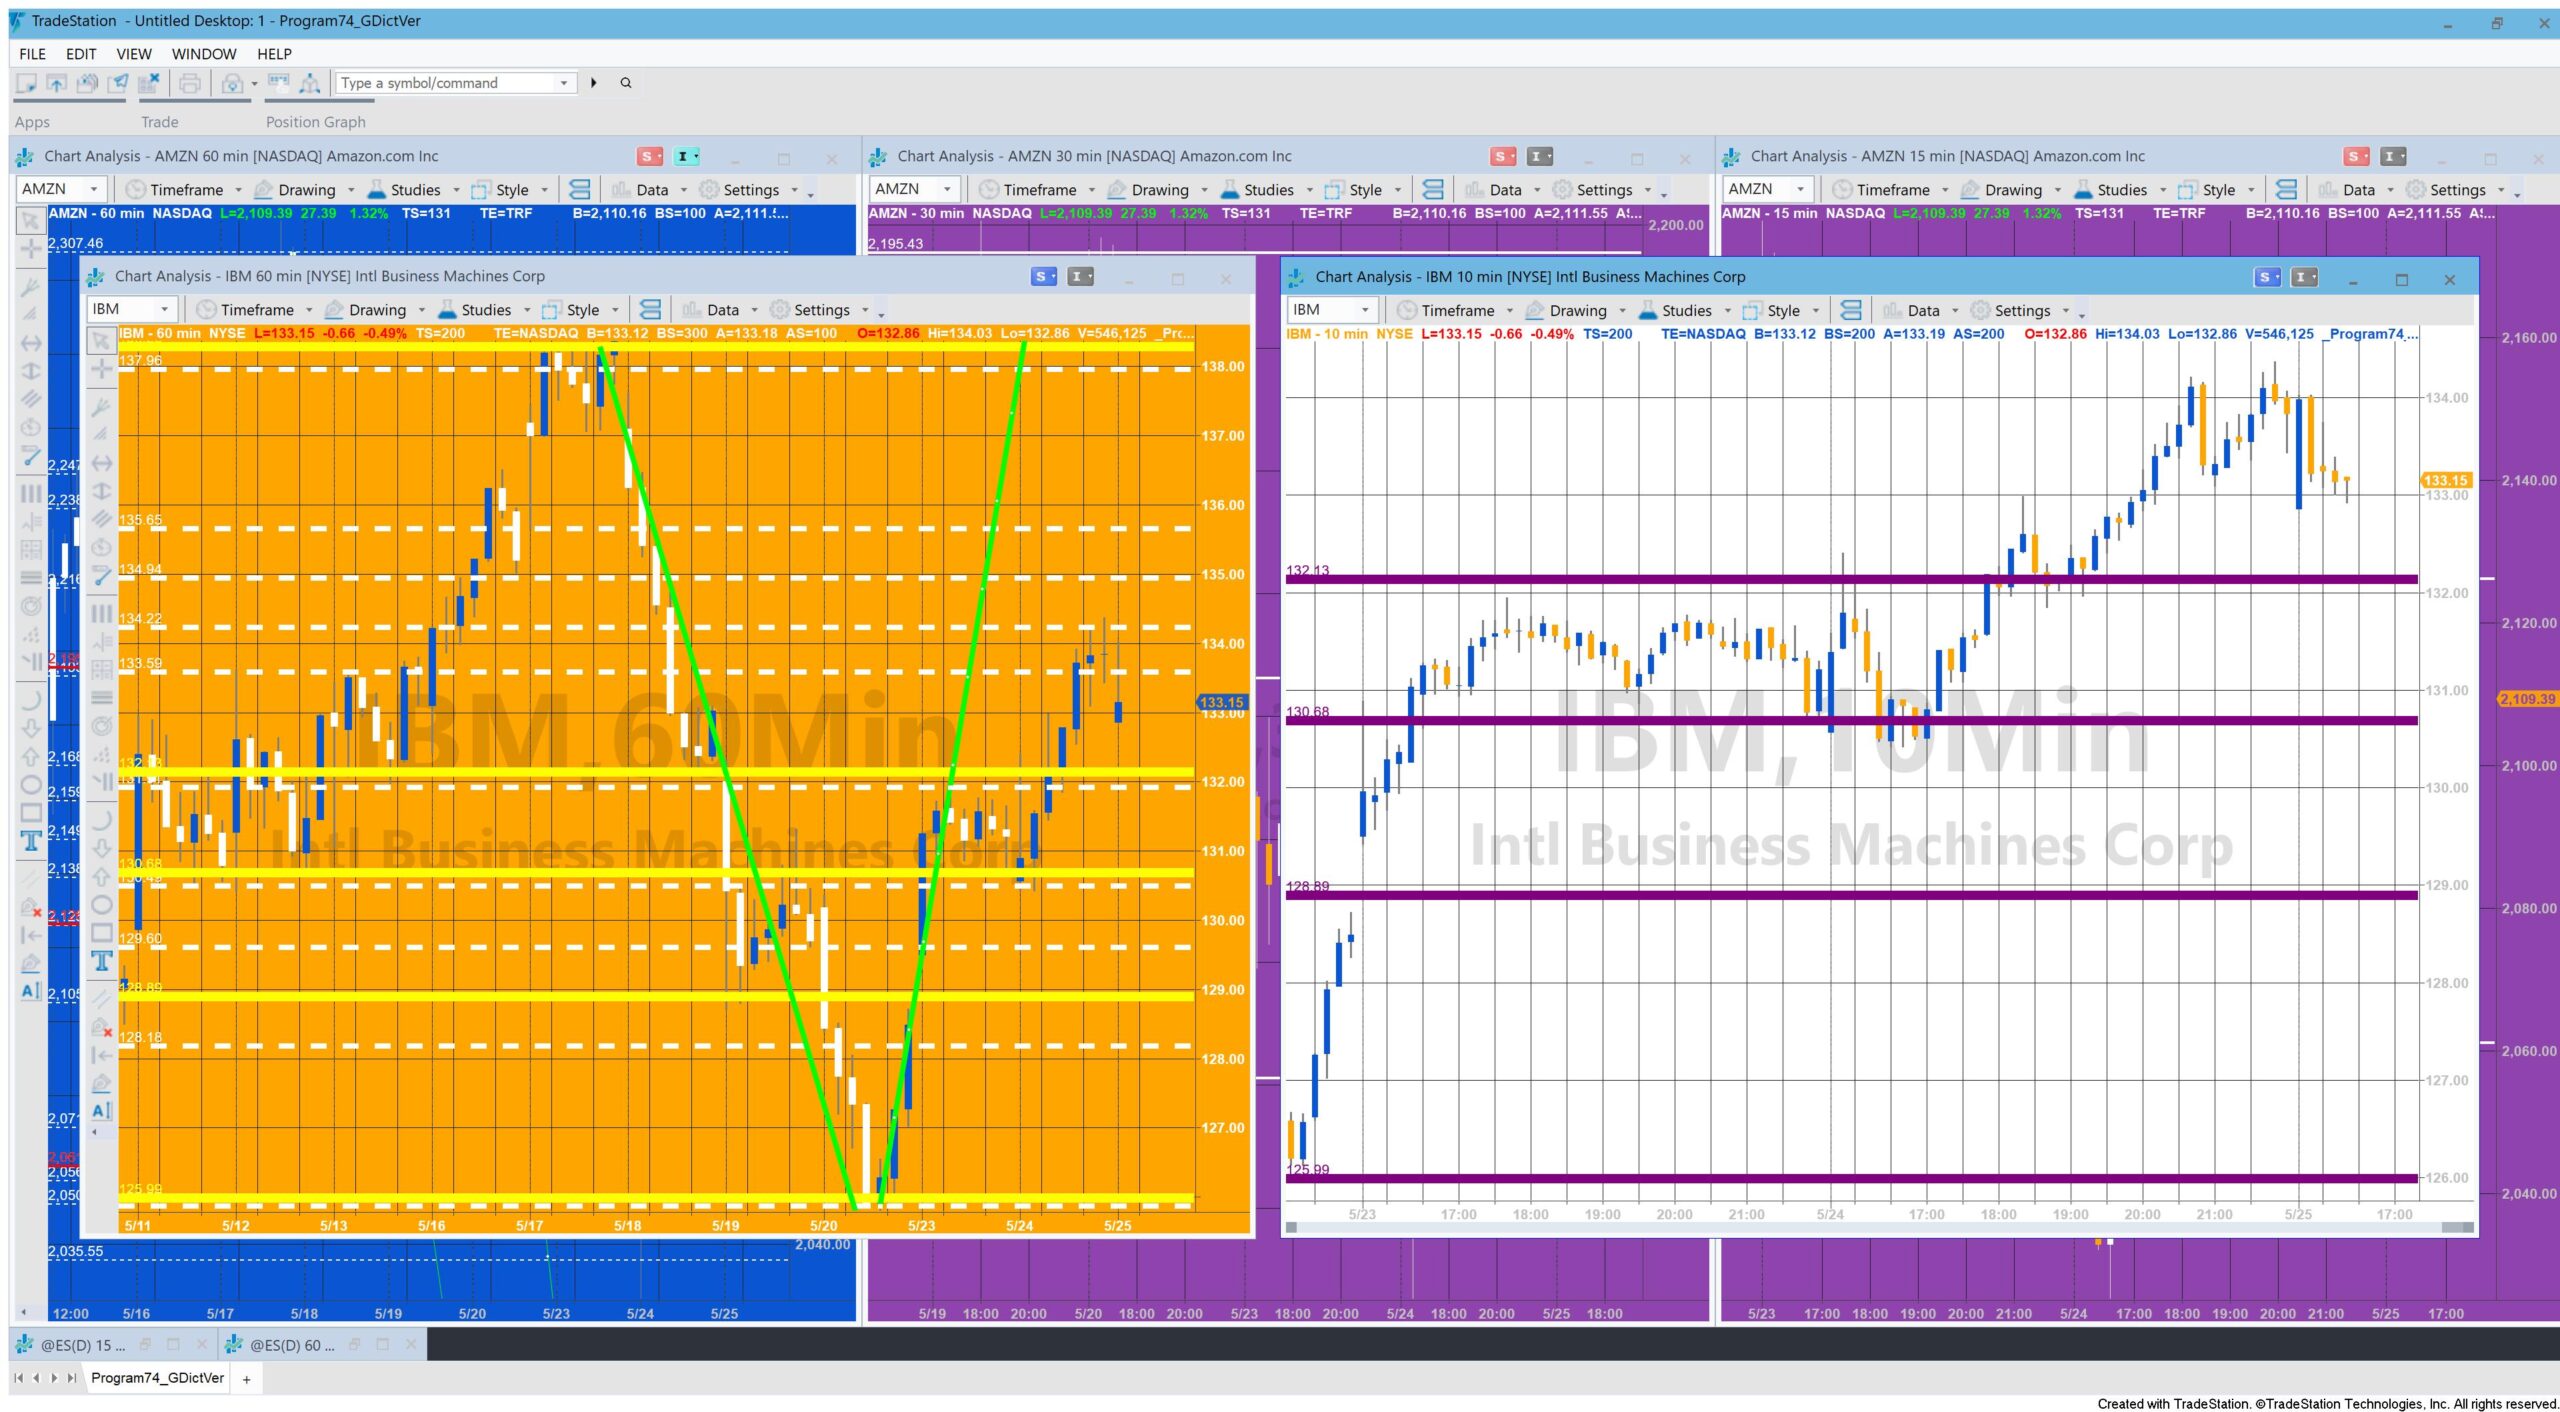
As new trend lines are added, the program calculates when the Fibonacci levels (the white dotted lines) relating to the drawn lines are ‘convergent’ (close to each other according to a user input). The convergent lines are drawn on the chart (the thicker yellow lines) and their price levels are stored in the GlobalDictionary.
A separate receiver program (_Program74_GDictVer_Rec, an Indicator) reads the information from the GlobalDictionary and draws lines on charts where it is inserted. In the above image the receiving chart is the chart with a white background and the lines, corresponding with the yellow lines on the sending chart, are drawn in purple.
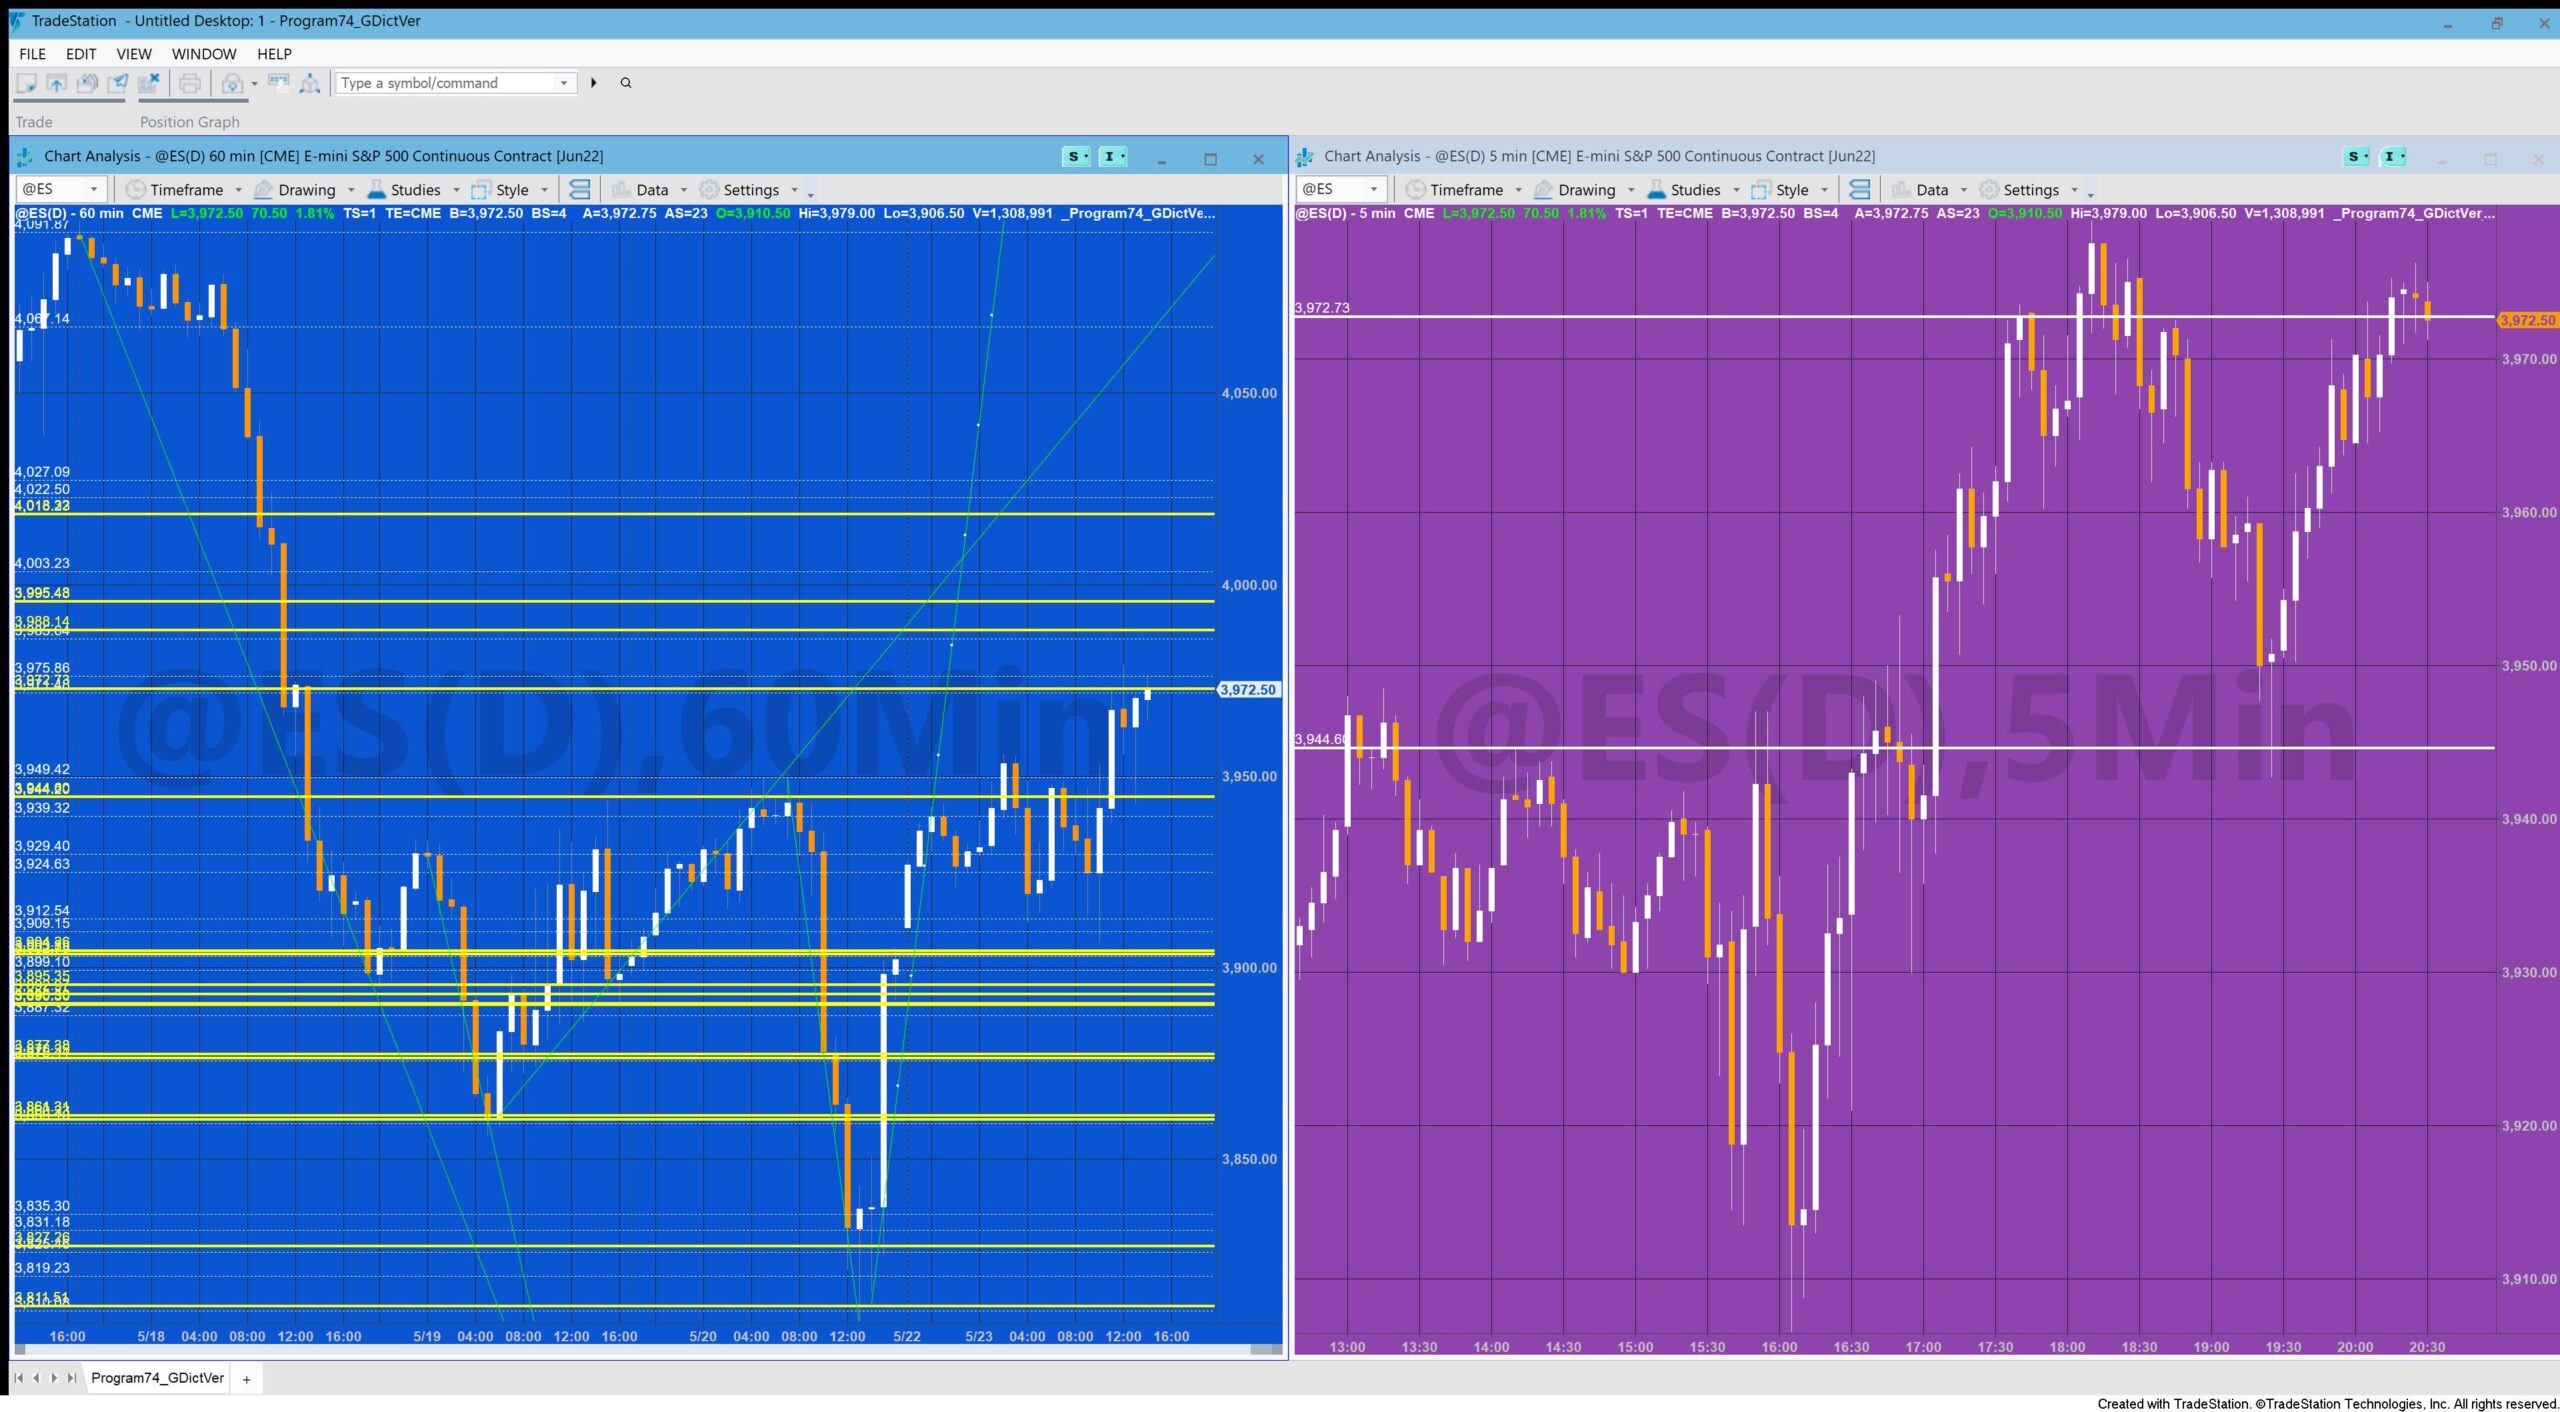
The ‘sending’ and ‘receiving’ programs are coordinated by the use of a user input: UniqueName. This means that, so long as different UniqueName values are used, it is possible to have several different sending and receiving charts. It is also possible to have a sending chart ‘sending’ levels data to two or more ‘receiving’ charts.
A previous program: _Program74V1.1 uses the GlobalVariable.DLL to share data between 2 charts. This approach required that users visited the TradeStation forum and downloaded and installed the latest version of the GlobalVariable.DLL and store it on their computer. Since this DLL was released, the GlobalDictionary became available.
GlobalDictionary gives a programmer the ability to create a collection of key/value pairs without installing additional software. This data in the key/value pairs can be shared between EasyLanguage analysis techniques and strategies. GlobalDictionary can be configured in two ways: to share values within the same window type and to share with additional window types. This new program (_Program74_GDictVer) uses the GlobalDictionary and means that the user no longer has to install the GlobalVariable.DLL but uses a capability that is already built into TradeStation.
Download Program 74 (Global Dictionary Edition) AND the Program 74 (GlobalVariable.DLL Edition)
These TradeStation EasyLanguage programs are fully functional and unprotected, i.e. you can see the source code.
After download the program can be opened, you will be able to see the program code and modify it. After purchase you will be redirected to a download page, so don’t close the browser.
Note that the program 74 package was developed for TradeStation 9.5 and above and is not compatible with MultiCharts.
The download consists of an ELD that includes this program: _Program74_GDictVer and _Program74_GDictVer_Rec. It also inclueds _Program74V1.1 and _Program74V1.1-Receiver. These were the programs originally included with the GlobalVariable.DLL version of program 74.
Inputs
The inputs for the sending program: _Program74_GDictVer are
double ProximityVal( 1 ), // Filter horizontal lines to leave only the ones that are within this value to each other
string UniqueName( “List” ), // Unique name used for key in global variable. Make sure this is the same string as used in the receiving chart
// Color the trend line drawn
string TLColor( “Green” ), // Set the trendlines to this color
// Style the Fib lines
string FColor( “White” ), // Set the color of the Fibonacci lines
int FWeight( 0 ), // Set the weight of the Fibonacci lines
// Style the convergence lines
string CColor( “Yellow” ), // Set the color of the convergence lines
int CWeight( 3 ); // Set the weight of the convergence lines
The inputs for the receiving program: _Program74_GDictVer_Rec are
string UniqueName( “List” ), // Unique name used for key in global variable. Make sure this is the same string as used in the sending chart
string FColor( “White” ), // Set the color of the horizontal lines
int FWeight( 3 ); // Set the weight of the horizontal lines
Programming techniques used in the programs
- Programmatically retrieve data about trendlines drawn with the drawing tools
- Add a click event to a trend line drawn with the drawing tools
- Detect when a trend line is clicked
- Create and use vector
- Draw horizontal lines
- Store horizontal lines in a vector
- Store a vector in the tag of the trend line
- Store levels in a vector which is, in turn, stored in the Global Dictionary
- Style trend lines and horizontal lines
- Use the _VectorQuickSort function
- Generate an exception of inputs values are incorrect
- Retrieving data from the Global Dictionary
- Deleting and creating horizontal lines
- Using the timer
Styling options
On the sending chart, the trendline (i.e. the line you draw manually) can be styled for color using the TLColor input. The horizontal lines that show the calculated Fibonacci levels can be styled for color and weight by FColor and FWeight respectively. The convergent lines can be styled for color and weight by CColor and CWeight respectively.
On the receiving chart, the horizontal lines can be styled for color and weight by FColor and FWeight respectively.
A StopCalculationException is generated if FWeight or CWeight are not acceptable values. Make sure FWeight and CWeight inputs are between 0 and 6.
Color options
| AliceBlue | DarkSlateGray | LightSalmon | PaleVioletRed |
| AntiqueWhite | DarkTurquoise | LightSeaGreen | PapayaWhip |
| Aqua | DarkViolet | LightSkyBlue | PeachPuff |
| Aquamarine | DeepPink | LightSlateGray | Peru |
| Azure | DeepSkyBlue | LightSteelBlue | Pink |
| Beige | DimGray | LightYellow | Plum |
| Bisque | DodgerBlue | Lime | PowderBlue |
| Black | Firebrick | LimeGreen | Purple |
| BlanchedAlmond | FloralWhite | Linen | Red |
| Blue | ForestGreen | Magenta | RosyBrown |
| BlueViolet | Fuschia | Maroon | RoyalBlue |
| Brown | Gainsboro | MediumAquamarine | SaddleBrown |
| Burlywood | GhostWhite | MediumBlue | Salmon |
| CadetBlue | Gold | MediumOrchid | SandyBrown |
| Chartreuse | Goldenrod | MediumPurple | SeaGreen |
| Chocolate | Gray | MediumSeaGreen | Seashell |
| Coral | Green | MediumSlateBlue | Sienna |
| CornflowerBlue | GreenYellow | MediumSpringGreen | Silver |
| Cornsilk | Honeydew | MediumTurquoise | SkyBlue |
| Cyan | HotPink | MediumVioletRed | SlateBlue |
| DarkBlue | IndianRed | MidnightBlue | SlateGray |
| DarkBrown | Indigo | MintCream | Snow |
| DarkCyan | Ivory | MistyRose | SpringGreen |
| DarkGoldenrod | Khaki | Moccasin | SteelBlue |
| DarkGray | Lavender | NavajoWhite | Tan |
| DarkGreen | LavenderBlush | Navy | Teal |
| DarkKhaki | LawnGreen | OldLace | Thistle |
| Dark Magenta | LemonChiffon | Olive | Tomato |
| DarkOliveGreen | LightBlue | OliveDrab | Turquoise |
| DarkOrange | LightCoral | Orange | Violet |
| DarkOrchid | LightCyan | OrangeRed | Wheat |
| DarkRed | LightGoldenrodYellow | Orchid | White |
| DarkSalmon | LightGray | PaleGoldenrod | WhiteSmoke |
| DarkSeaGreen | LightGreen | PaleGreen | Yellow |
| DarkSlateBlue | LightPink | PaleTurquoise | YellowGreen |
THE TRADING APPS, INDICATORS, SHOW ME STUDIES, STRATEGIES AND OTHER PROGRAMS HAVE BEEN INCLUDED SOLELY FOR EDUCATIONAL PURPOSES.
TO THE BEST OF MARKPLEX CORPORATION’S KNOWLEDGE, ALL OF THE INFORMATION ON THIS PAGE IS CORRECT, AND IT IS PROVIDED IN THE HOPE THAT IT WILL BE USEFUL. HOWEVER, MARKPLEX CORPORATION ASSUMES NO LIABILITY FOR ANY DAMAGES, DIRECT OR OTHERWISE, RESULTING FROM THE USE OF THIS INFORMATION AND/OR PROGRAM(S) DESCRIBED, AND NO WARRANTY IS MADE REGARDING ITS ACCURACY OR COMPLETENESS. USE OF THIS INFORMATION AND/OR PROGRAMS DESCRIBED IS AT YOUR OWN RISK.
ANY EASYLANGUAGE OR POWERLANGUAGE TRADING STRATEGIES, TRADING APPS, SIGNALS, STUDIES, INDICATORS, SHOWME STUDIES, PAINTBAR STUDIES, PROBABILITYMAP STUDIES, ACTIVITYBAR STUDIES, FUNCTIONS (AND PARTS THEREOF) AND ASSOCIATED TECHNIQUES REFERRED TO, INCLUDED IN OR ATTACHED TO THIS TUTORIAL OR PROGRAM DESCRIPTION ARE EXAMPLES ONLY, AND HAVE BEEN INCLUDED SOLELY FOR EDUCATIONAL PURPOSES. MARKPLEX CORPORATION. DOES NOT RECOMMEND THAT YOU USE ANY SUCH TRADING STRATEGIES, SIGNALS, STUDIES, INDICATORS, SHOWME STUDIES, PAINTBAR STUDIES, PROBABILITYMAP STUDIES, ACTIVITYBAR STUDIES, FUNCTIONS (OR ANY PARTS THEREOF) OR TECHNIQUES. THE USE OF ANY SUCH TRADING STRATEGIES, SIGNALS, STUDIES, INDICATORS, SHOWME STUDIES, PAINTBAR STUDIES, PROBABILITYMAP STUDIES, ACTIVITYBAR STUDIES, FUNCTIONS AND TECHNIQUES DOES NOT GUARANTEE THAT YOU WILL MAKE PROFITS, INCREASE PROFITS, OR MINIMIZE LOSSES.

