
Analysis of volume at chart price levels for the last week
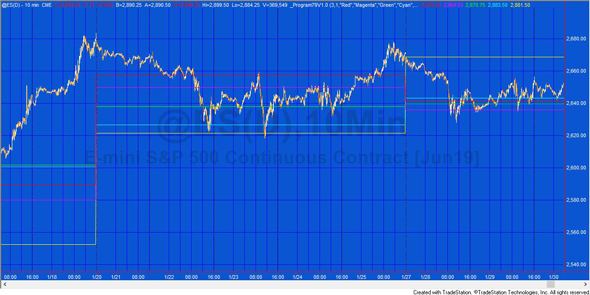
 Program 79 estimates horizontal support and resistance lines based on the chart’s volume profile for the previous week.
The theory underlying program 79 is that if significant volume has occurred at a specific price level then, perhaps, that level have some significance as a level of support and/or resistance.
Watch the overview video below.
Similar programs include program 56 and program 78.
- Program 79 analyses data over the last week.
- Program 78 analyzes a user defined number of bars starting from the last completed bar on the chart and counting backwards.
- Program 56 analyzes all the bars on a chart (after maxbarsback).
Program 79 is available for immediate download for $94.95. The download is a TradeStation ELD file that includes the unprotected and commented program. This program will not work in MultiCharts because it uses the TradeStation collections and other functionality that is not available in the MultiCharts environment.
- Plots the lines rather than drawing them
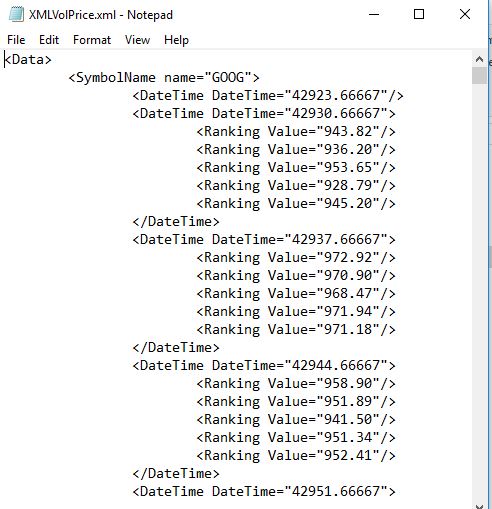
- Stores calculated data in an XML file. If later reapplied to a chart this data is utilized to provide plot levels without having to recalculate them
- Retrieves volume or tick data from a price series provider. The interval span is set by a user input
- Requires that weekly data for the symbol being analyzed is loaded as Data2
The code underlying the storage of previously calculated values in an XML file, may have applications in other projects that you are interested in that are very data and calculation intensive.
The program 79 volume profile calculation
At the end of each week the volume profile is stored in a dictionary for that week. The closing price (converted to a string) is used as the index and the sum of volume for bars closing at that price is stored as the value.
At the end of each week the program counts back through the week and populates the volume profile dictionary by examining each bar. If there is not an index in the dictionary for a specific closing price, the closing price (converted to a string) and the volume are added to the dictionary. If the closing price is found in the dictionary, the volume of the newly found bar is added to the volume for this price.
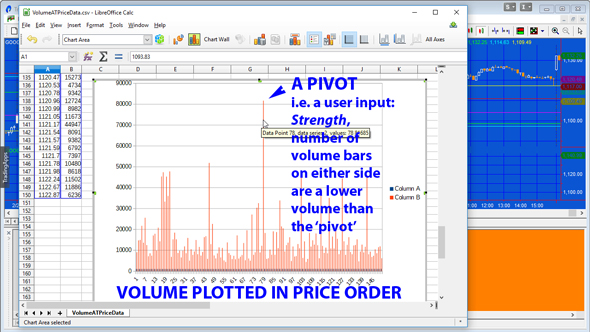
See the ‘spreadsheet analysis’ video below to see a visualization of this calculation.
Finding volume ‘pivots’
Once the volume profile dictionary is populated or updated, program 79 looks for volume ‘pivots’. Referring to the image below, to qualify as a pivot there must be a user specified number of smaller bars above the pivot and below the pivot.
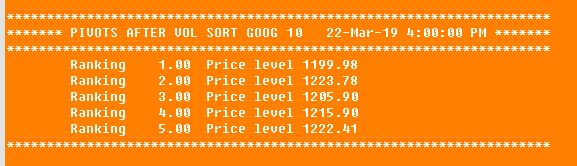
Once found these ‘pivots’ are stored in another dictionary (PriceVolumePivots). A vector of the keys for this new dictionary are then sorted by their volume values and the resulting price levels are drawn on the chart. The volume pivot with the highest volume is plotted using user input: Color1, the next highest is plotted using Color2 etc.
If the user input Print_Dialog is set to TRUE, program 79 also prints the information in the print log.
Tips when using the program
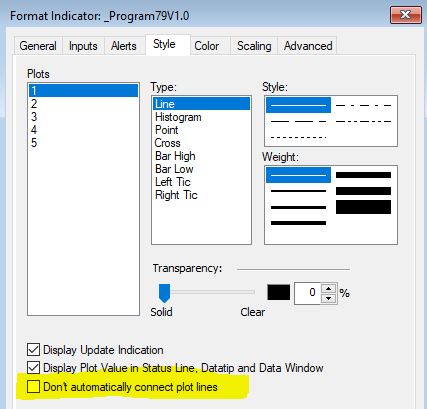
Make sure that in the plot format, “Don’t automatically join plots” is NOT selected for each of plot 1, 2, 3, 4, and 5.
Recalculation to regenerate the XML file
If you wish to do a recalculation for the chart, first turn the status of the program to OFF, then delete the XML file that was created previously, then turn the status of the program to ON.
Commented out print statements
Print statements were added to the program to create the ‘spreadsheet analysis’ video below. These statements are commented out and are not necessary for the running of the program. They are left in the source code in case you wish to use them to do your own verification or capture other data.
Video overview
Spreadsheet analysis for program 79
The dictionary write method
Inputs
Strength
Left and right strength of volume pivots
int Strength( 3 ), // Strength of pivots
Plot colors
The following inputs determine the color of the horizontal plots. Color1 would be for the level for which the volume pivot for the week has the greatest volume, color2 the level that has the next highest volume etc
string Color1( “Red” ),
string Color2( “Magenta” ),
string Color3( “Green” ),
string Color4( “Cyan” ),
string Color5( “Yellow” ),
Use ticks or volume
int TicksOrVol( 1 ), // 0 = use ticks, 1 = use volume
The interval span of the price series provider
int Intspan( 10 ), // The interval span (in minutes) to be used by the price series provider
Use the print dialogue
bool Print_Dialog( True ), // If set to TRUE, line information is printed in the print dialog
XML file name
string xmlFileName( “C:\XMLVolPrice.xml” ); // Name and location of XML file
Technical architecture and programming lessons
Program 79 uses vectors and dictionaries extensively. It may be useful if you are looking for examples of:
- Populating dictionaries
- Locating a dictionary entry and updating its value
- Deleting dictionary entries
- Extracting vectors of values and keys from a dictionary
- Sorting a vector
- Finding ‘volume pivots’ in a dictionary
- Printing the contents of a dictionary to a file
- Using XML files: storing information in a structured way and reading it back
- Using the StreamWriter class
- Using data2 to indicate the end of the week
Please email if you find any bugs or have questions.
THESE INDICATORS, SHOW ME STUDIES, STRATEGIES AND OTHER PROGRAMS HAVE BEEN INCLUDED SOLELY FOR EDUCATIONAL PURPOSES.
TO THE BEST OF MARKPLEX CORPORATION’S KNOWLEDGE, ALL OF THE INFORMATION ON THIS PAGE IS CORRECT, AND IT IS PROVIDED IN THE HOPE THAT IT WILL BE USEFUL. HOWEVER, MARKPLEX CORPORATION ASSUMES NO LIABILITY FOR ANY DAMAGES, DIRECT OR OTHERWISE, RESULTING FROM THE USE OF THIS INFORMATION AND/OR PROGRAM(S) DESCRIBED, AND NO WARRANTY IS MADE REGARDING ITS ACCURACY OR COMPLETENESS. USE OF THIS INFORMATION AND/OR PROGRAMS DESCRIBED IS AT YOUR OWN RISK.
ANY EASYLANGUAGE OR POWERLANGUAGE TRADING STRATEGIES, SIGNALS, STUDIES, INDICATORS, SHOWME STUDIES, PAINTBAR STUDIES, PROBABILITYMAP STUDIES, ACTIVITYBAR STUDIES, FUNCTIONS (AND PARTS THEREOF) AND ASSOCIATED TECHNIQUES REFERRED TO, INCLUDED IN OR ATTACHED TO THIS TUTORIAL OR PROGRAM DESCRIPTION ARE EXAMPLES ONLY, AND HAVE BEEN INCLUDED SOLELY FOR EDUCATIONAL PURPOSES. MARKPLEX CORPORATION. DOES NOT RECOMMEND THAT YOU USE ANY SUCH TRADING STRATEGIES, SIGNALS, STUDIES, INDICATORS, SHOWME STUDIES, PAINTBAR STUDIES, PROBABILITYMAP STUDIES, ACTIVITYBAR STUDIES, FUNCTIONS (OR ANY PARTS THEREOF) OR TECHNIQUES. THE USE OF ANY SUCH TRADING STRATEGIES, SIGNALS, STUDIES, INDICATORS, SHOWME STUDIES, PAINTBAR STUDIES, PROBABILITYMAP STUDIES, ACTIVITYBAR STUDIES, FUNCTIONS AND TECHNIQUES DOES NOT GUARANTEE THAT YOU WILL MAKE PROFITS, INCREASE PROFITS, OR MINIMIZE LOSSES.