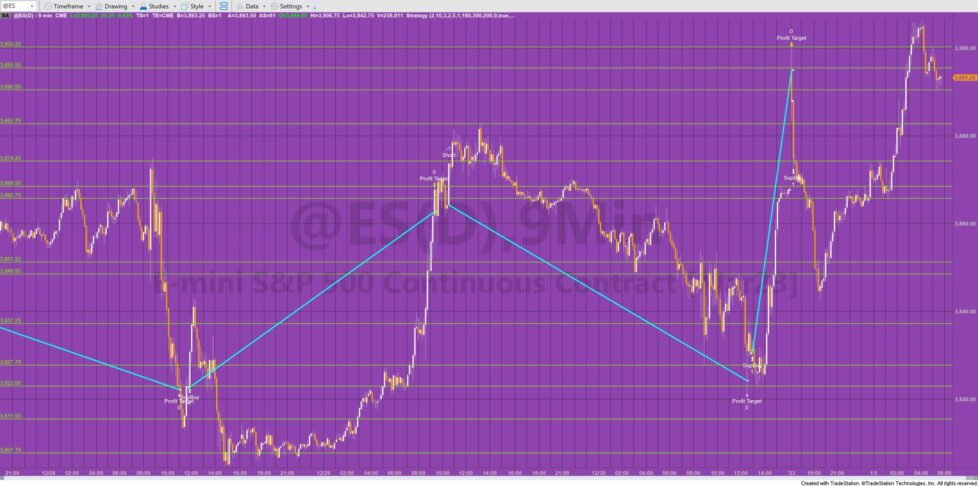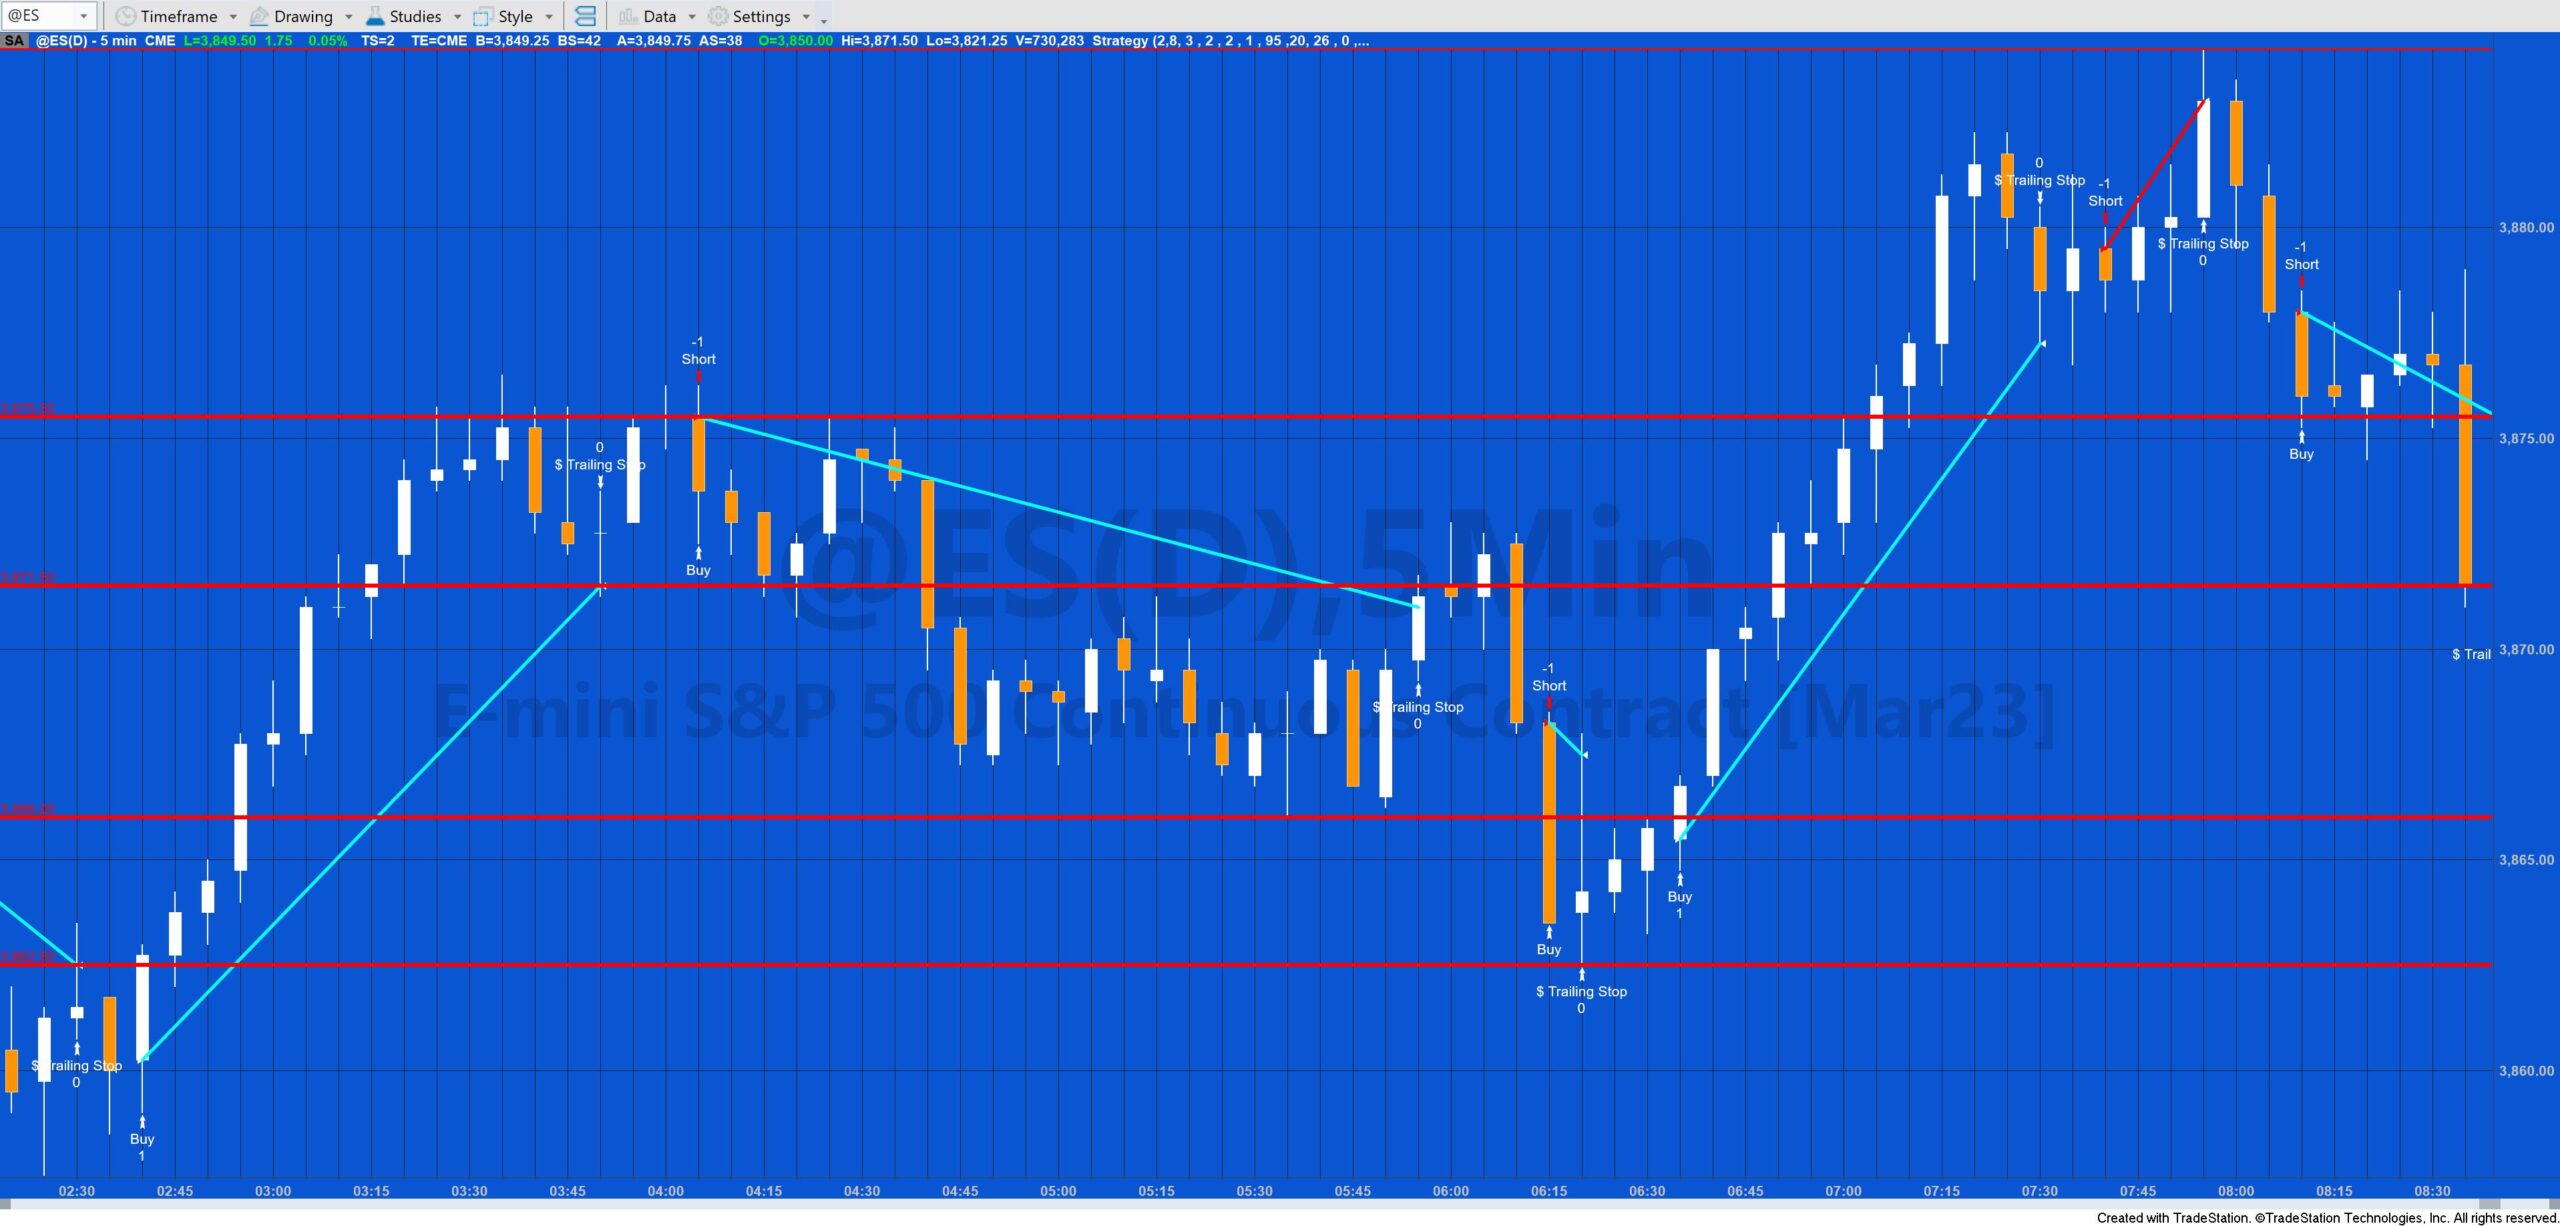
Program85, a TradeStation EasyLanguage strategy component, calculates horizontal support and resistance lines based on the levels of previous high and low pivots. It uses these support and resistance levels in combination with the following factors to determine whether to issue a market order:
- the value of the newly formed pivot
- user defined filters
- the strength (i.e. the minimum number of times a pivot has occurred at or near to a specific level)
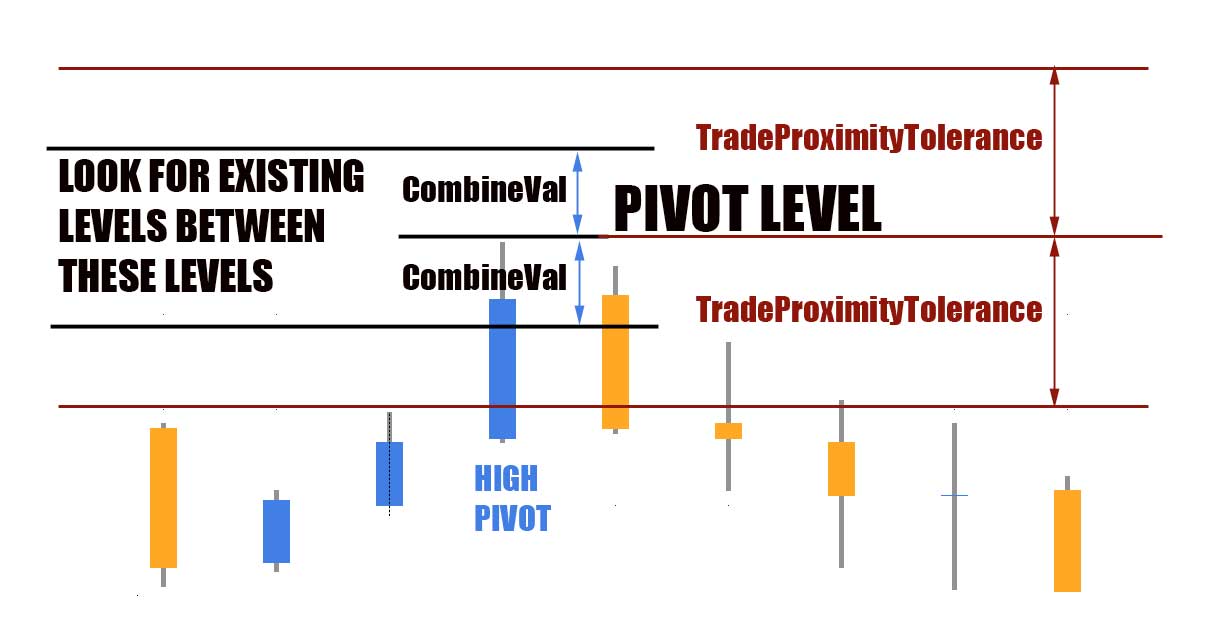
If a pivot occurs within user input: TradeProximityTolerance of an existing support or resistance level, the program evaluates the user defined filters (set to TRUE by default) and the strength. If they all evaluate to true a market order is generated. A sell short market order is generated if such a high pivot occurs and a buy order if a low pivot occurs.
The above illustration shows a high pivot. The program searches for and combines levels within the range CombineVal above and below the pivot level. It then searches again for levels over a certain strength value in the range TradeProximityTolerance above and below the pivot. In this case, if such a level were found a sell short order would be made because this is a high pivot.
Calculation of the support and resistance levels
The program is similar to program 55 by analyzing the current chart as it looks for pivots. The idea behind the program is that if pivots have occurred at a specific level before, then that price level may have some significance as far as support or resistance is concerned, especially if they have occurred at the same level (or near to the same level) on several occasions before.
Each time a new pivot is found, _Program85 stores information about the pivot (i.e the datetime it occurred, the number of occurrences, with initial value equal to one, and the price level) in a vector: LineVector. This vector is in turn stored in another vector: PivotVector.
The program then analyzes all the levels already stored in PivotVector. If the new pivot is within, user input: CombineVal of a line already stored in PivotVector then the number of occurrences of the existing line is added to the new line, and the number occurrences of the existing line is set to zero. When all the levels stored in PivotVector have been analyzed, another routine removes entries where the occurrences value is zero.
Horizontal lines representing the support and resistance levels are drawn for the last bar on the chart if the DrawLines user input is set to true.
The performance of program 85 depends on many factors including the symbol, bar length, amount of data loaded and the user defined filters. The program could be potentially improved further by the user by analyzing the potential entry bar as to how it is situated in relation to significant levels stored in PivotVector.
User inputs
CombineVal( 0 ), // The price difference above or below a line to increase the occurance value for the line
TradeProximityTolerance( 1 ), // How close a pivot needs to be to initiate a trade
LeftStrength( 3 ), // Left strength of pivots
RightStrength( 2 ), // Right strength of pivots
Strength( 2 ), // The number of pivots that have been combined with a specific horizontal line
// Trade management inputs
NumCts( 1 ), // Number of contracts to buy or sell
TargetTicks( 95 ), // Number of ticks for target
TrailTicks( 100 ), // Trailing ticks
StopLossTicks( 26 ), // Initial stop loss ticks (calculated from the signal bar)
EODExitTime( 0 ), // Set to zero if no end of day exit. otherwise set at time before exit bar
DrawLines( False ), // Set to true to draw the horizontal lines
// Define color for lines
LineColor( “Red” ),
// Define line styles for lines
LineStyle( 0 ),
LineThickness( 1 ); // Defines thickness of lines. LineThickness can be a positive integer up to 6
Example filter
The following snippet of code is an example of a filter that could be used with this program
// Example filter

Input:	double MinDiff( 0.1 ),
		int FastLength( 8 ),
		int MedLength( 14 ),
		int SlowLength( 26 );

Vars:	double FastAvg( 0 ),
		double MedAvg( 0 ),
		double SlowAvg( 0 ),
		double FastPct( 0 ),
		double MedPct( 0 ),
		double SlowPct( 0 ),
		double Diff( 0 );

FastAvg = Average( C, FastLength );
MedAvg = Average( C, MedLength );
SlowAvg = Average( C, SlowLength );

if FastAvg <> 0 then FastPct = ( C - FastAvg ) / FastAvg * 100;
if MedAvg <> 0 then MedPct = ( C - MedAvg ) / MedAvg * 100;
if SlowAvg <> 0 then SlowPct = ( C - SlowAvg ) / SlowAvg * 100;

Diff = MaxList( FastPCT, MedPct, SlowPct ) - MinList( FastPCT, MedPct, SlowPct );
LongFilter1 = Diff >= MinDiff;
l
The tutorial program is not compatible with MultiCharts as it makes extensive use of objects.
Video explaining program 85
Colors available for LineColor input
| AliceBlue | DarkSlateGray | LightSalmon | PaleVioletRed |
| AntiqueWhite | DarkTurquoise | LightSeaGreen | PapayaWhip |
| Aqua | DarkViolet | LightSkyBlue | PeachPuff |
| Aquamarine | DeepPink | LightSlateGray | Peru |
| Azure | DeepSkyBlue | LightSteelBlue | Pink |
| Beige | DimGray | LightYellow | Plum |
| Bisque | DodgerBlue | Lime | PowderBlue |
| Black | Firebrick | LimeGreen | Purple |
| BlanchedAlmond | FloralWhite | Linen | Red |
| Blue | ForestGreen | Magenta | RosyBrown |
| BlueViolet | Fuschia | Maroon | RoyalBlue |
| Brown | Gainsboro | MediumAquamarine | SaddleBrown |
| Burlywood | GhostWhite | MediumBlue | Salmon |
| CadetBlue | Gold | MediumOrchid | SandyBrown |
| Chartreuse | Goldenrod | MediumPurple | SeaGreen |
| Chocolate | Gray | MediumSeaGreen | Seashell |
| Coral | Green | MediumSlateBlue | Sienna |
| CornflowerBlue | GreenYellow | MediumSpringGreen | Silver |
| Cornsilk | Honeydew | MediumTurquoise | SkyBlue |
| Cyan | HotPink | MediumVioletRed | SlateBlue |
| DarkBlue | IndianRed | MidnightBlue | SlateGray |
| DarkBrown | Indigo | MintCream | Snow |
| DarkCyan | Ivory | MistyRose | SpringGreen |
| DarkGoldenrod | Khaki | Moccasin | SteelBlue |
| DarkGray | Lavender | NavajoWhite | Tan |
| DarkGreen | LavenderBlush | Navy | Teal |
| DarkKhaki | LawnGreen | OldLace | Thistle |
| Dark Magenta | LemonChiffon | Olive | Tomato |
| DarkOliveGreen | LightBlue | OliveDrab | Turquoise |
| DarkOrange | LightCoral | Orange | Violet |
| DarkOrchid | LightCyan | OrangeRed | Wheat |
| DarkRed | LightGoldenrodYellow | Orchid | White |
| DarkSalmon | LightGray | PaleGoldenrod | WhiteSmoke |
| DarkSeaGreen | LightGreen | PaleGreen | Yellow |
| DarkSlateBlue | LightPink | PaleTurquoise | YellowGreen |
TO THE BEST OF MARKPLEX CORPORATION’S KNOWLEDGE, ALL OF THE INFORMATION ON THIS PAGE IS CORRECT, AND IT IS PROVIDED IN THE HOPE THAT IT WILL BE USEFUL. HOWEVER, MARKPLEX CORPORATION ASSUMES NO LIABILITY FOR ANY DAMAGES, DIRECT OR OTHERWISE, RESULTING FROM THE USE OF THIS INFORMATION AND/OR PROGRAM(S) DESCRIBED, AND NO WARRANTY IS MADE REGARDING ITS ACCURACY OR COMPLETENESS. USE OF THIS INFORMATION AND/OR PROGRAMS DESCRIBED IS AT YOUR OWN RISK.
ANY EASYLANGUAGE OR POWERLANGUAGE TRADING STRATEGIES, SIGNALS, STUDIES, INDICATORS, SHOWME STUDIES, PAINTBAR STUDIES, PROBABILITYMAP STUDIES, ACTIVITYBAR STUDIES, FUNCTIONS (AND PARTS THEREOF) AND ASSOCIATED TECHNIQUES REFERRED TO, INCLUDED IN OR ATTACHED TO THIS TUTORIAL OR PROGRAM DESCRIPTION ARE EXAMPLES ONLY, AND HAVE BEEN INCLUDED SOLELY FOR EDUCATIONAL PURPOSES. MARKPLEX CORPORATION. DOES NOT RECOMMEND THAT YOU USE ANY SUCH TRADING STRATEGIES, SIGNALS, STUDIES, INDICATORS, SHOWME STUDIES, PAINTBAR STUDIES, PROBABILITYMAP STUDIES, ACTIVITYBAR STUDIES, FUNCTIONS (OR ANY PARTS THEREOF) OR TECHNIQUES. THE USE OF ANY SUCH TRADING STRATEGIES, SIGNALS, STUDIES, INDICATORS, SHOWME STUDIES, PAINTBAR STUDIES, PROBABILITYMAP STUDIES, ACTIVITYBAR STUDIES, FUNCTIONS AND TECHNIQUES DOES NOT GUARANTEE THAT YOU WILL MAKE PROFITS, INCREASE PROFITS, OR MINIMIZE LOSSES.


