
Keeping text objects at a constant pixel value from low when scrolling or resizing a window
You may have noticed that when you apply a text label to a chart at a specific price, perhaps something below or above a bar, and then scroll the chart, that the distance between the drawing object and the bar changes.
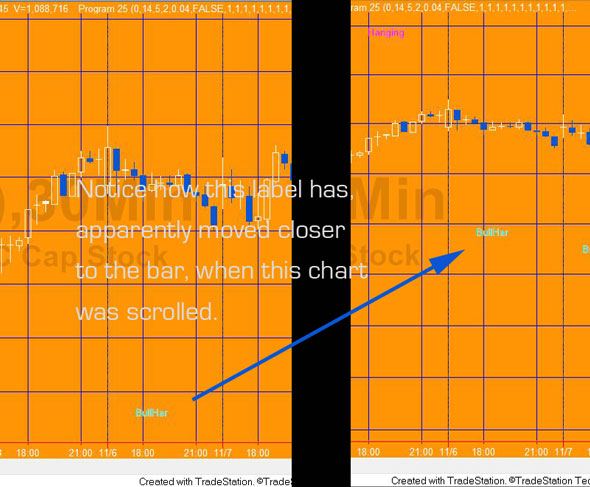
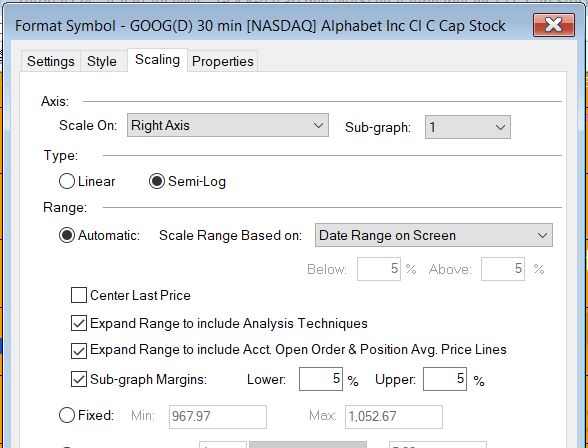
This occurs when the range in Format – Symbol – Scaling is set to automatic, date range on screen. See image below.
A Gold Pass member asked how it might be possible to make labels stay a fixed number of pixels from a bar (rather than a fixed price difference). This may seem like a somewhat esoteric question, BUT it does provide several interesting lessons in the use of drawing objects, the charting host object, the timer, collections, other things that you may be able to apply in other programs.
The tutorial program is available for download and, additionally, Gold Pass members have access to a bonus video.
Programming lessons in _Tutorial124
The tutorial demonstrates how to:
- Create a vector
- Use the TradeStation Hammer function
- Add text label drawing objects to the chart
- Determine the height and width of a chart
- Determine the highest and lowest prices on a chart
- Detect when a chart is resized
- Detect when the chart is scrolled
- Create a method with an input
- Populate a vector with all the drawing objects on the chart of a specific type (text label)
- Use a for loop to loop through the vector
- Find the position of all the text label drawing objects on the chart
- Change the position of a text label
- Change the string in a text label
How _Tutorial124 works
When first applied to a chart, _Tutorial124 measures the difference between the high and the low of chart and also the height of the chart in pixels. It then calculates a ratio equal to the height of the chart divided by the price difference.
The program searches for Hammer candlestick patterns, when it find one it draws a text label 4 ticks price difference below the low of the pattern. The text label takes the price level of the label, converted to a string.
The program then looks for the client window being resized or the chart being scrolled. If either occur the height of the chart divided by the price difference ratio is recalculated and passed as an input to a method (MoveText). Each time this method is called it copies all the text label objects into a vector and then for each text label it ascertains which bar it is applied to and then re-positions the text based on the relationship between the original height/price difference ratio and that which has been recalculated to ensure that the pixel difference remains the same. It also updates the text label string to reflect its new position.
The resizing of the chart is detected by an event handler in the charting host object.
As of TradeStation version 9.5, there is no event handler to detect if a chart has been scrolled. In this case we monitor the value of the leftmost display date time. This is done every tick and using a timer that is set to fire every 500 milli-seconds.
See the video and notes below for more information.
Addendum
Line 20
Intrabarpersist double LastLeftVal( GetAppInfo( aiLeftDispDateTime ) );
Note: this ensures that the LastLeftVal is set up correctly when the program is initialized.
Line 167
If LastBarOnChartEx then LastLeftVal = GetAppInfo( aiLeftDispDateTime );
LastLeftVal only needs to be updated for the last bar on chart
[download_box]If you wish to save yourself some time typing in the code for _Tutorial124, the UNPROTECTED TradeStation indicator ( _Tutorial124) containing tutorial program (i.e. the TradeStation EasyLanguage is fully functional and you can see the source code) is available for IMMEDIATE download for $19.95- by clicking the ‘add to cart’ button. The program works with TradeStation but, unfortunately, not with MultiCharts.
After download the programs can be opened, you will be able to see the program code and modify it if you wish.
After purchase you will be redirected to a download page, so don’t close the browser.[/download_box]
Video explanation of tutorial 124
Two potential ‘gotchas’
Gotcha 1
A BNPoint refers to the absolute bar index (zero-based) of the collection of bars in a chart. This is not the same as the BarNumber function or CurrentBar reserved word which count the number of bars available for analysis after MaxBarsBack. So to create a BNPoint for the current bar (BarNumber) would be: NewBar = BarNumber + MaxBarsBack – 1;
Gotcha 2
Another issue that can cause what appear to be spurious results are the ‘Show empty daily trading periods for traditional chart types’ and ‘Show empty intraday session periods for traditional chart types’ settings. 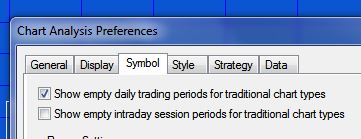 If these are selected, the chart includes blank bars which ‘confuse’ the bar number for BNPoints. For example, in the following daily chart of IBM, the ‘Show empty daily trading periods for traditional chart types’ is selected.
Gold Pass area
Make sure that you are logged in to view the following bonus video in which I describe, in more detail, how we get and set data in the Text label objects.
Please let me know if you spot any bugs or errors.
THESE INDICATORS, SHOW ME STUDIES, STRATEGIES AND OTHER PROGRAMS HAVE BEEN INCLUDED SOLELY FOR EDUCATIONAL PURPOSES.
TO THE BEST OF MARKPLEX CORPORATION’S KNOWLEDGE, ALL OF THE INFORMATION ON THIS PAGE IS CORRECT, AND IT IS PROVIDED IN THE HOPE THAT IT WILL BE USEFUL. HOWEVER, MARKPLEX CORPORATION ASSUMES NO LIABILITY FOR ANY DAMAGES, DIRECT OR OTHERWISE, RESULTING FROM THE USE OF THIS INFORMATION AND/OR PROGRAM(S) DESCRIBED, AND NO WARRANTY IS MADE REGARDING ITS ACCURACY OR COMPLETENESS. USE OF THIS INFORMATION AND/OR PROGRAMS DESCRIBED IS AT YOUR OWN RISK.
ANY EASYLANGUAGE OR POWERLANGUAGE TRADING STRATEGIES, SIGNALS, STUDIES, INDICATORS, SHOWME STUDIES, PAINTBAR STUDIES, PROBABILITYMAP STUDIES, ACTIVITYBAR STUDIES, FUNCTIONS (AND PARTS THEREOF) AND ASSOCIATED TECHNIQUES REFERRED TO, INCLUDED IN OR ATTACHED TO THIS TUTORIAL OR PROGRAM DESCRIPTION ARE EXAMPLES ONLY, AND HAVE BEEN INCLUDED SOLELY FOR EDUCATIONAL PURPOSES. MARKPLEX CORPORATION. DOES NOT RECOMMEND THAT YOU USE ANY SUCH TRADING STRATEGIES, SIGNALS, STUDIES, INDICATORS, SHOWME STUDIES, PAINTBAR STUDIES, PROBABILITYMAP STUDIES, ACTIVITYBAR STUDIES, FUNCTIONS (OR ANY PARTS THEREOF) OR TECHNIQUES. THE USE OF ANY SUCH TRADING STRATEGIES, SIGNALS, STUDIES, INDICATORS, SHOWME STUDIES, PAINTBAR STUDIES, PROBABILITYMAP STUDIES, ACTIVITYBAR STUDIES, FUNCTIONS AND TECHNIQUES DOES NOT GUARANTEE THAT YOU WILL MAKE PROFITS, INCREASE PROFITS, OR MINIMIZE LOSSES.