
Getting bid, ask and market depth information using the Market Depth Provider
Tutorial 126 demonstrates the TradeStation market depth provider. Unfortunately this functionality is not available in MultiCharts.
In order for the tutorial to function it needs to be applied to a symbol for which you have market depth data. In addition, these examples use CBOE futures where the number of participants at each level are equal to 1.
This tutorial is organized in two parts. The first part builds and explains _Tutorial126_Simple. In the second I talk through the more complicated _Tutorial126.
_Tutorial126_Simple
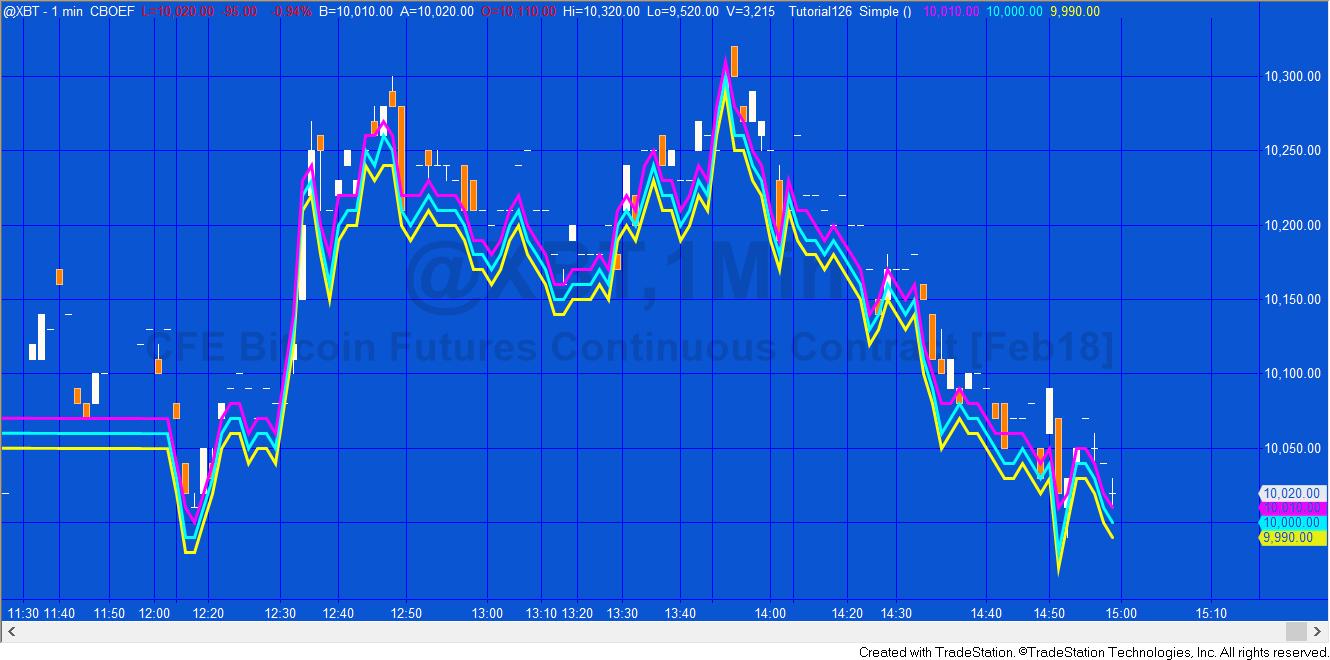
_Tutorial126_Simple explains how relatively easy it is to call the Market Depth Provider and to plot three levels of bid pricing in real time.
Gold Pass members can download _Tutorial126_Simple for free.
Programming lessons in _Tutorial126_Simple
The tutorial demonstrates how to:
- Create an instance of the Market Depth Provider by using the EasyLanguage toolbox and populating the property fields
- Create the Market Depth Provider State Changed and Updated update events
- Plot bid levels
Gold Pass area
Gold pass members, make sure that you are logged in to download the _Tutorial126_Simple for free.![]() This content is for members only.
This content is for members only.
Download _Tutorial126_Simple
The UNPROTECTED TradeStation indicator ( _Tutorial126_Simple) is available for IMMEDIATE download for $4.95- by clicking the ‘add to cart’ button.
After purchase you will be redirected to a download page, so don’t close the browser.
N.B. The more complicated tutorial program that creates the histogram is available below.
Video explanation of _Tutorial 126_Simple
_Tutorial126
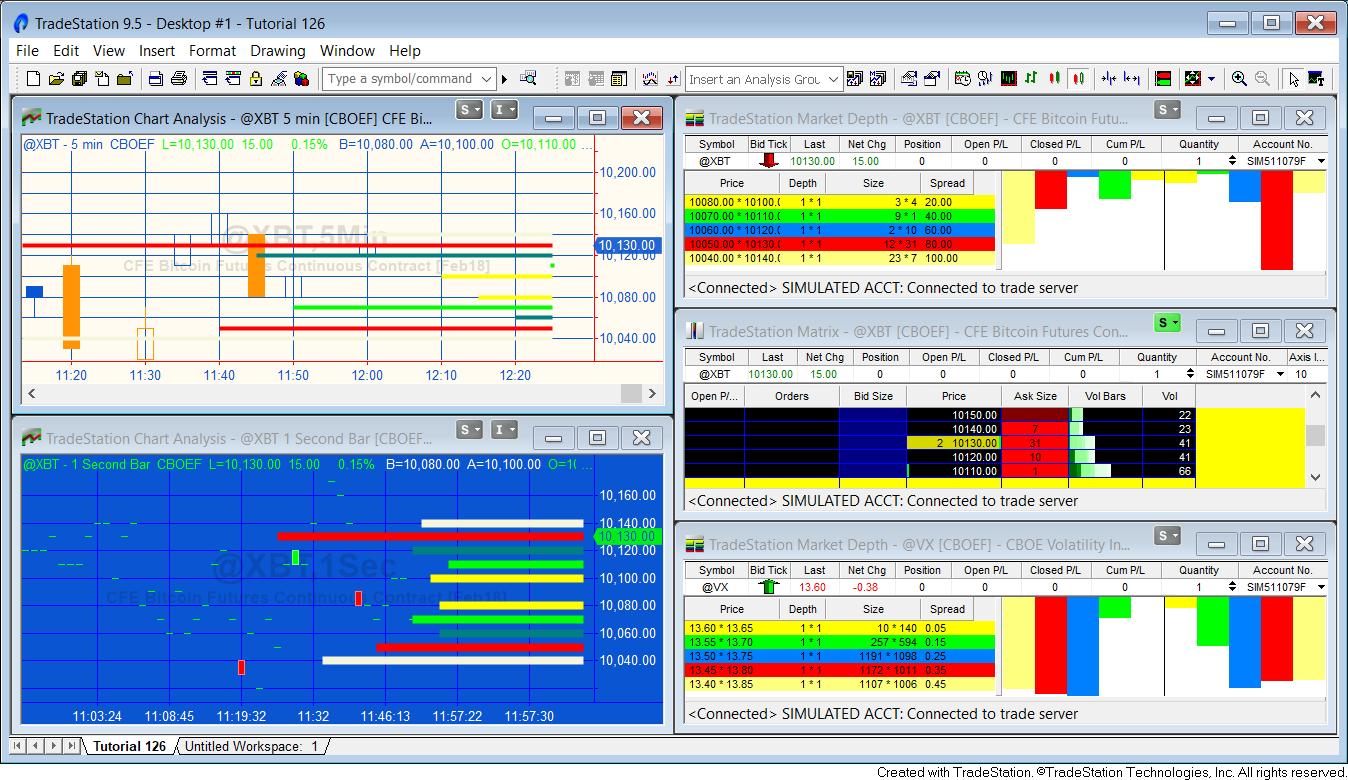
_Tutorial126 also uses the Market Depth Provider but in this case the price and size information and drawn on the chart in the form of a histogram. The lines are positioned at the level of the inside bid and the next 4 bids and at the level of the inside ask and the next 4 asks. The length of the lines are proportionate to the size at each bid or ask level. The lines are updated and moved whenever the underlying market depth data changes.
Programming lessons in _Tutorial126
_Tutorial126 demonstrates how to:
- Use the Market Depth Provider
- Use the Market Depth Provider State Changed and Updated update events
- Draw trendlines on the chart and update their size and position as the Market Depth Provider updates
- Create DateTime points to position the trend lines
- Determine the datetime of the right of the chart and convert it from a double precision number into a DateTime object
- Create vectors and populate them with colors and trendline objects
- Re-position trend lines
- Subtract a number of minutes from a datetime object
How _Tutorial126 works
See the video and notes below for more information.
_Tutorial126 creates a Market Depth Provider for the symbol of the chart to which is applied.
When first applied to a chart (or when refreshed) the program creates a vector and populates it with five color objects. It then uses a For loop to create trend trend lines which it positions in arbitrary positions (the lines are re-positioned when the Market Depth Provider update event fires). Each line is given a color from the color palette vector, depending on its bid or ask level. In the example, the inside bid and inside ask are colored yellow, the next levels green etc.
The thickness of the lines is set by the user input: HistWeight. The other user input: Scale, determines the length of the histogram bars. The bars are equal to Scale multiplied by the size of the level, expressed in minutes. For this reason, the program makes most sense when applied to a intraday time based chart with the scale adjusted depending on the length of the bars.
_Tutorial126 uses two update events: state changed and updated. The state change is used to print when the market depth provider is loaded or when it fails. When the update event fires the program:
- Loops through a vector that contains trend line objects relating to five bid levels and five ask levels
- For each trendline, if a bid level/ask level exists, it re-positions it according to the current bid or ask price (respectively)
- It alters the length of the trend line proportionate to the bid or ask size (respectively)
Download _Tutorial126
After purchase you will be redirected to a download page, so don’t close the browser.
Video explanation of tutorial 126
Please let me know if you spot any bugs or errors or have questions.
THESE INDICATORS, SHOW ME STUDIES, STRATEGIES AND OTHER PROGRAMS HAVE BEEN INCLUDED SOLELY FOR EDUCATIONAL PURPOSES.
TO THE BEST OF MARKPLEX CORPORATION’S KNOWLEDGE, ALL OF THE INFORMATION ON THIS PAGE IS CORRECT, AND IT IS PROVIDED IN THE HOPE THAT IT WILL BE USEFUL. HOWEVER, MARKPLEX CORPORATION ASSUMES NO LIABILITY FOR ANY DAMAGES, DIRECT OR OTHERWISE, RESULTING FROM THE USE OF THIS INFORMATION AND/OR PROGRAM(S) DESCRIBED, AND NO WARRANTY IS MADE REGARDING ITS ACCURACY OR COMPLETENESS. USE OF THIS INFORMATION AND/OR PROGRAMS DESCRIBED IS AT YOUR OWN RISK.
ANY EASYLANGUAGE OR POWERLANGUAGE TRADING STRATEGIES, SIGNALS, STUDIES, INDICATORS, SHOWME STUDIES, PAINTBAR STUDIES, PROBABILITYMAP STUDIES, ACTIVITYBAR STUDIES, FUNCTIONS (AND PARTS THEREOF) AND ASSOCIATED TECHNIQUES REFERRED TO, INCLUDED IN OR ATTACHED TO THIS TUTORIAL OR PROGRAM DESCRIPTION ARE EXAMPLES ONLY, AND HAVE BEEN INCLUDED SOLELY FOR EDUCATIONAL PURPOSES. MARKPLEX CORPORATION. DOES NOT RECOMMEND THAT YOU USE ANY SUCH TRADING STRATEGIES, SIGNALS, STUDIES, INDICATORS, SHOWME STUDIES, PAINTBAR STUDIES, PROBABILITYMAP STUDIES, ACTIVITYBAR STUDIES, FUNCTIONS (OR ANY PARTS THEREOF) OR TECHNIQUES. THE USE OF ANY SUCH TRADING STRATEGIES, SIGNALS, STUDIES, INDICATORS, SHOWME STUDIES, PAINTBAR STUDIES, PROBABILITYMAP STUDIES, ACTIVITYBAR STUDIES, FUNCTIONS AND TECHNIQUES DOES NOT GUARANTEE THAT YOU WILL MAKE PROFITS, INCREASE PROFITS, OR MINIMIZE LOSSES.