
Tutorial 130 | Part 1 | Creating a linear regression channel plot
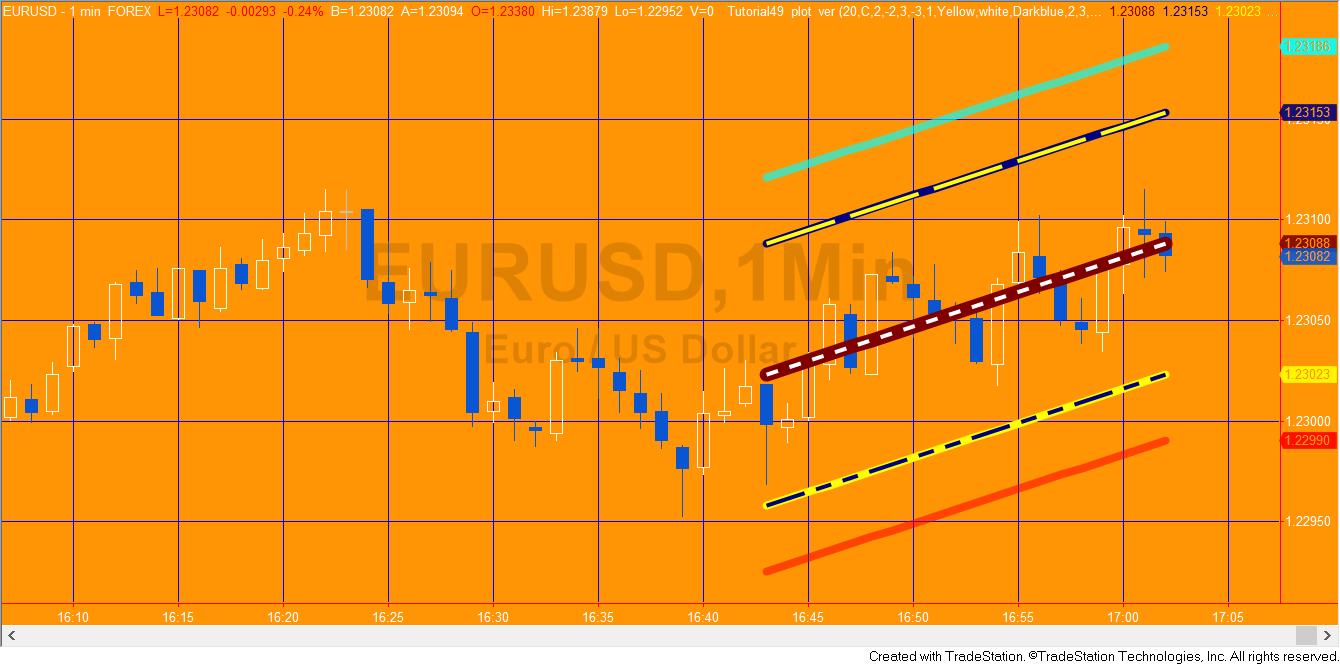
 Back in tutorial 49 I created a linear regression show me study that used TradeStation’s legacy drawing tools to draw a linear regression channel.
Tutorial 130 demonstrates how tutorial 49 could be rewritten using Plot statements as a TradeStation indicator (but still including the original legacy drawing statements). In part 2 (see below), I demonstrate the program after the legacy drawing tools have been removed.
There are several advantages in using plot statements rather than the legacy drawing tools:
-
- The plots can be formatted using TradeStation’s standard plot dialogs for color, style, and transparency
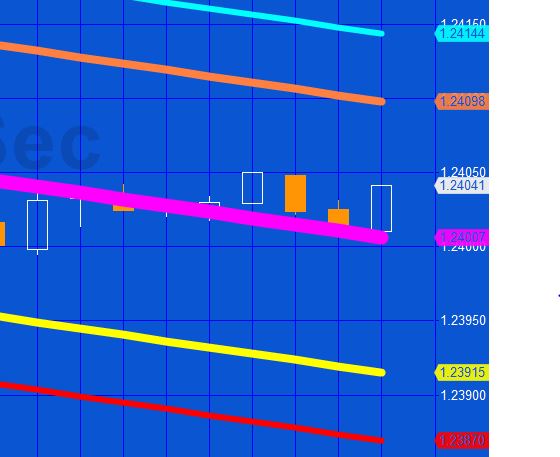
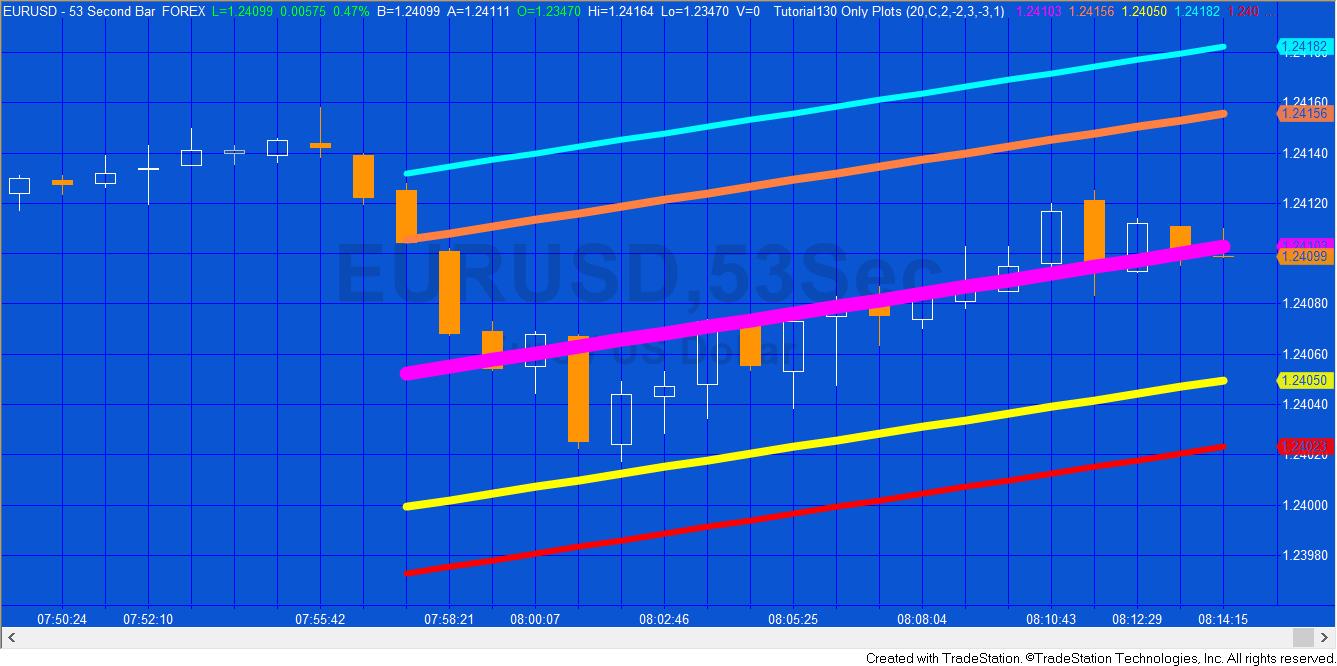
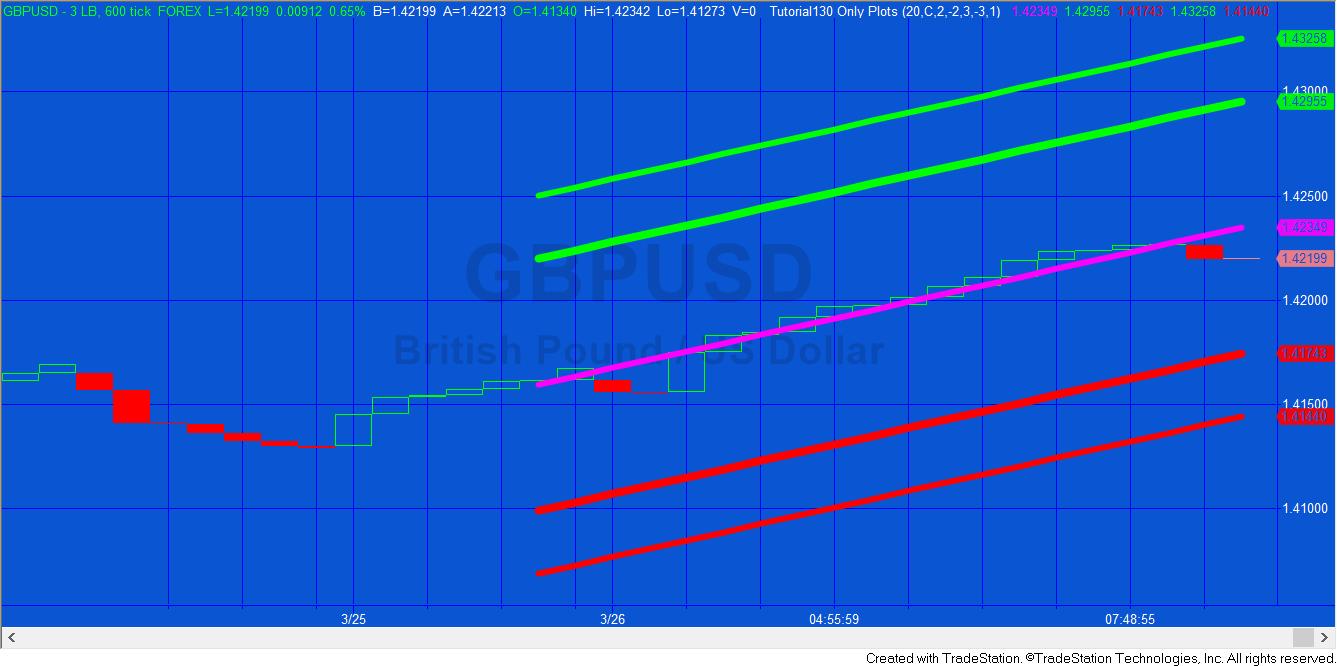
- Plots can be used on sub-minute bars, e.g. tick, second, advanced bar charts (whereas the legacy drawing tools are only accurate when used to the minute level)
- The syntax is a lot simpler when new lines need to be added
- By overlaying the drawing on top of the plot gives the user more display options
- It is optional as to whether you set color defaults in the program
- A setting in the TradeStation indicator dialog enables you to determine whether the indicator updates every tick or a the end of the bar
- Markers show the end values of the levels in the price axis (if turned on)
On the downside plots have the following disadvantages:
- Only one Plot1, Plot2, Plot3 etc is allowed per bar, therefore option 2 in the tutorial program is not possible using plots (at least not easily)
- The style options (dashes etc) are limited at the heavier weights
Some of the benefits of using Plot to create a linear regression channel:


The following is plot syntax to plot something (in this case Plot1 plots Value1 and Plot2 plots Value2) on the current bar:
Plot1( Value1 );
Plot2[0]( Value2 );
The following plots something on the last bar:
Plot2[1]( Value2 );
and this would plot something on the bar before that:
Plot2[2]( Value2 );
The linear regression calculations are covered extensively in tutorial 48. You might also be interested in program 63. Program 63 draws linear regression lines, and then creates a smoothed plot based on the linear regression end point. It also offers the option to plot oscillators based on non-smoothed plots.
Areas covered in Tutorial 130
The tutorial demonstrates how to:
- Use and format legacy drawing tools
- Plot values on historic bars
- Make historic plots appear to disappear by using the transparent color attribute
Inputs
NumBars( 20 ), // The number of bars to consider when calculating the linear regression
Price( C ), // The price to consider when calculating the linear regression
NumDevsUp( 2 ), // The number of standard deviations of the end of the linear regression to draw upper channel above linear regression line
NumDevsDn( -2 ), // The number of standard deviations of the end of the linear regression to draw lower channel below linear regression line
NumDevsUp2( 3 ), // The number of standard deviations of the end of the linear regression to draw second upper channel above linear regression line
NumDevsDn2( -3 ), // The number of standard deviations of the end of the linear regression to draw second lower channel below linear regression line
GraphOption( 3 ), // See different presentation options explained below
// Style options for the lines that are drawn
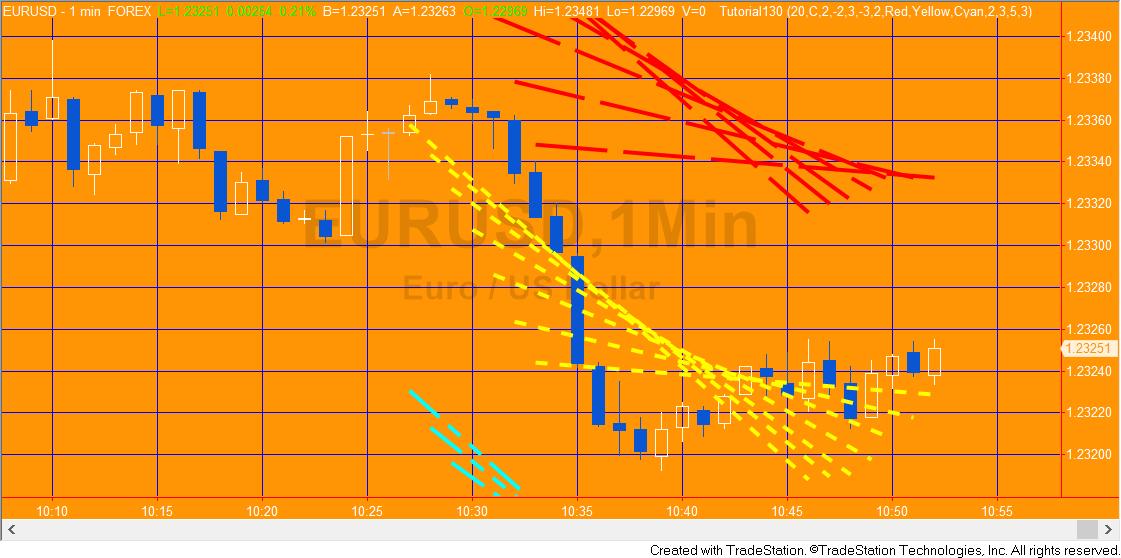
TopLineCol( Red ), // Color of the line above the mid line
MidLineCol( Yellow ), // Color of the mid line
LowLineCol( Cyan ), // Color of the line below the mid line
{ 1 Tool_Solid
2 Tool_Dashed
3 Tool_Dotted
4 Tool_Dashed2
5 Tool_Dashed3 }
TopLineStyle( 1 ), // Style (e.g. solid or dashed) of the line above the mid line
MidLineStyle( 3 ), // Style (e.g. solid or dashed) of the mid line
LowLineStyle( 5 ), // Style (e.g. solid or dashed) of the line below the mid line
LineThickness( 3 ); // Thickness of all the lines (must be an integer between 0 and 6)
GraphOption input


GraphOption = 1: The linear regression is continually calculated for the last NumBars bars on the chart. Lines are plotted and drawn for the last NumBars.
GraphOption = 2: The linear regression is continually calculated for the last NumBars bars on the chart. Lines are drawn for the last NumBars. Once a line has been drawn, it remains on the chart.
GraphOption = 3: When applied to the chart the linear regression is calculated for the last NumBars bars on the chart. Lines are plotted and drawn for the last NumBars. As new bars are added the linear regression moves across the chart.
Video explanation of Tutorial 130
Please let me know if you spot any mistakes or errors or have questions.
Tutorial 130 | Part 2
Note: This tutorial program is included in the part 1 download above.
In part 2 of this tutorial I remove the parts of tutorial 130 which used the TradeStation legacy drawing syntax, those leaving the linear regression line plotted, rather than drawn and plotted. I also considerable simplified the tutorial program (named _Tutorial130 Only Plots), hopefully making it easier to understand.
In the tutorial I demonstrate how to add additional channels to the program as well as its use on second and tick charts.
Video explanation of Tutorial 130 Only Plots
Gold Pass area
_Tutorial130 Only Plots is also available at no cost to Gold Pass members below. Make sure that you are logged into Gold Pass.
Notes for MultiCharts users
MultiCharts currently does not support using Transparent in the Plot statement. This is used in both the tutorial 130 programs.
A possible workaround is to replace lines such as:
Plot1[NumBars]( C[Numbars], "Mid", Transparent );
with:
Plot1[NumBars]( C[Numbars], "Mid", getbackgroundcolor,Default, 0 );
This code colors the unwanted plots to be the same as the background and changes their thickness.
The workaround does result in thin lines sometimes partially obscuring the bars and wicks.
THESE INDICATORS, SHOW ME STUDIES, STRATEGIES AND OTHER PROGRAMS HAVE BEEN INCLUDED SOLELY FOR EDUCATIONAL PURPOSES.
TO THE BEST OF MARKPLEX CORPORATION’S KNOWLEDGE, ALL OF THE INFORMATION ON THIS PAGE IS CORRECT, AND IT IS PROVIDED IN THE HOPE THAT IT WILL BE USEFUL. HOWEVER, MARKPLEX CORPORATION ASSUMES NO LIABILITY FOR ANY DAMAGES, DIRECT OR OTHERWISE, RESULTING FROM THE USE OF THIS INFORMATION AND/OR PROGRAM(S) DESCRIBED, AND NO WARRANTY IS MADE REGARDING ITS ACCURACY OR COMPLETENESS. USE OF THIS INFORMATION AND/OR PROGRAMS DESCRIBED IS AT YOUR OWN RISK.
ANY EASYLANGUAGE OR POWERLANGUAGE TRADING STRATEGIES, SIGNALS, STUDIES, INDICATORS, SHOWME STUDIES, PAINTBAR STUDIES, PROBABILITYMAP STUDIES, ACTIVITYBAR STUDIES, FUNCTIONS (AND PARTS THEREOF) AND ASSOCIATED TECHNIQUES REFERRED TO, INCLUDED IN OR ATTACHED TO THIS TUTORIAL OR PROGRAM DESCRIPTION ARE EXAMPLES ONLY, AND HAVE BEEN INCLUDED SOLELY FOR EDUCATIONAL PURPOSES. MARKPLEX CORPORATION. DOES NOT RECOMMEND THAT YOU USE ANY SUCH TRADING STRATEGIES, SIGNALS, STUDIES, INDICATORS, SHOWME STUDIES, PAINTBAR STUDIES, PROBABILITYMAP STUDIES, ACTIVITYBAR STUDIES, FUNCTIONS (OR ANY PARTS THEREOF) OR TECHNIQUES. THE USE OF ANY SUCH TRADING STRATEGIES, SIGNALS, STUDIES, INDICATORS, SHOWME STUDIES, PAINTBAR STUDIES, PROBABILITYMAP STUDIES, ACTIVITYBAR STUDIES, FUNCTIONS AND TECHNIQUES DOES NOT GUARANTEE THAT YOU WILL MAKE PROFITS, INCREASE PROFITS, OR MINIMIZE LOSSES.
Plot1[NumBars]( C[Numbars], "Mid", Transparent );