
Tutorial 132 | Calculate a value based on several rows in RadarScreen
 RadarScreen looks very much like a spreadsheet and you may wonder, how you could sum or perform some other spreadsheet like operation on a column of numbers or booleans? Despite of its appearance, each row in Radarscreen can best be thought of as if it were a separate chart, albeit with the plots expressed as the latest value rather than a graphical representation.
There are, however, ways of emulating spreadsheet like behavior and this is what this tutorial explores.
Tutorial 132 uses two different ways of achieving this. In the first the GlobalVariable.DLL is utilized. Even though this DLL was introduced a few years ago, it still does a good job sharing real time date between charts or rows in RadarScreen.
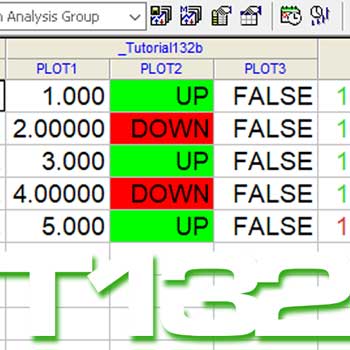
In this program we are specifically sharing information in the plot 2 column with all the other rows. The problem comes when the individual rows are waiting for a price tick to occur before updating. In other words, they have the correct information available to them but don’t do anything with it until the program next runs (on the next tick). This can result in the updates being slow and seemingly uncoordinated. You can see this occurring in image and the videos below. The GlobalVariable.DLL version is named _Tutorial132 (shown on the left).
The second approach is to use the GlobalDictionary which is now built into TradeStation as standard. This also does a great job in sharing the plot 2 status between all the rows but it also has the major advantage of having an event available that fires when an item stored in the dictionary is updated. For example, if row 1 was updated but price did not tick in any of the other rows, the event would still be fired for ALL the rows which can update Plot3 if necessary.
Tutorial 96 | Using the Workbook component to share information with Excel
Tutorial 113 | Using data from an Excel sheet to update an EasyLanguage program
Download
The tutorial 132 indicators (_Tutorial132 and _Tutorial132b) are available for download for $9.95 by clicking the following link. The programs works with TradeStation.
Video explanation of Tutorial 132 | Using the GlobalVariable.DLL
Video explanation of Tutorial 132 | Using the Global Dictionary
Please let me know if you spot any mistakes or errors or have questions.
THESE INDICATORS, SHOW ME STUDIES, STRATEGIES AND OTHER PROGRAMS HAVE BEEN INCLUDED SOLELY FOR EDUCATIONAL PURPOSES.
TO THE BEST OF MARKPLEX CORPORATION’S KNOWLEDGE, ALL OF THE INFORMATION ON THIS PAGE IS CORRECT, AND IT IS PROVIDED IN THE HOPE THAT IT WILL BE USEFUL. HOWEVER, MARKPLEX CORPORATION ASSUMES NO LIABILITY FOR ANY DAMAGES, DIRECT OR OTHERWISE, RESULTING FROM THE USE OF THIS INFORMATION AND/OR PROGRAM(S) DESCRIBED, AND NO WARRANTY IS MADE REGARDING ITS ACCURACY OR COMPLETENESS. USE OF THIS INFORMATION AND/OR PROGRAMS DESCRIBED IS AT YOUR OWN RISK.
ANY EASYLANGUAGE OR POWERLANGUAGE TRADING STRATEGIES, SIGNALS, STUDIES, INDICATORS, SHOWME STUDIES, PAINTBAR STUDIES, PROBABILITYMAP STUDIES, ACTIVITYBAR STUDIES, FUNCTIONS (AND PARTS THEREOF) AND ASSOCIATED TECHNIQUES REFERRED TO, INCLUDED IN OR ATTACHED TO THIS TUTORIAL OR PROGRAM DESCRIPTION ARE EXAMPLES ONLY, AND HAVE BEEN INCLUDED SOLELY FOR EDUCATIONAL PURPOSES. MARKPLEX CORPORATION. DOES NOT RECOMMEND THAT YOU USE ANY SUCH TRADING STRATEGIES, SIGNALS, STUDIES, INDICATORS, SHOWME STUDIES, PAINTBAR STUDIES, PROBABILITYMAP STUDIES, ACTIVITYBAR STUDIES, FUNCTIONS (OR ANY PARTS THEREOF) OR TECHNIQUES. THE USE OF ANY SUCH TRADING STRATEGIES, SIGNALS, STUDIES, INDICATORS, SHOWME STUDIES, PAINTBAR STUDIES, PROBABILITYMAP STUDIES, ACTIVITYBAR STUDIES, FUNCTIONS AND TECHNIQUES DOES NOT GUARANTEE THAT YOU WILL MAKE PROFITS, INCREASE PROFITS, OR MINIMIZE LOSSES.