

A Gold Pass member asked for a tutorial about how to ‘convert an indicator into a function.’ This is not literally possible because in EasyLanguage, indicators and functions have their own unique capabilities. It is, however, possible to take certain calculations out of an indicator, put them in a function and then call the function from the indicator (or strategy, show-me study, paint bar study etc.)
- Simplifying the code in the calling program (e.g. indicator or strategy)
- Reusing useful code among several calling programs
- Maintaining or improving code in a function that would then benefit many other programs
This tutorial contains two parts.
1. _Tutorial153 and _Tutorial153_Indicator
In part one I use the indicator code from tutorial 152 (which calculated the advancing issues and declining issues line (AD line) and create a new function (_Tutorial153) that returns three values:
- The AD value which updates whenever a new day begins. This is equivalent to the value plotted on the daily chart
- The AD value updated throughout the day
- The slope of the daily AD line
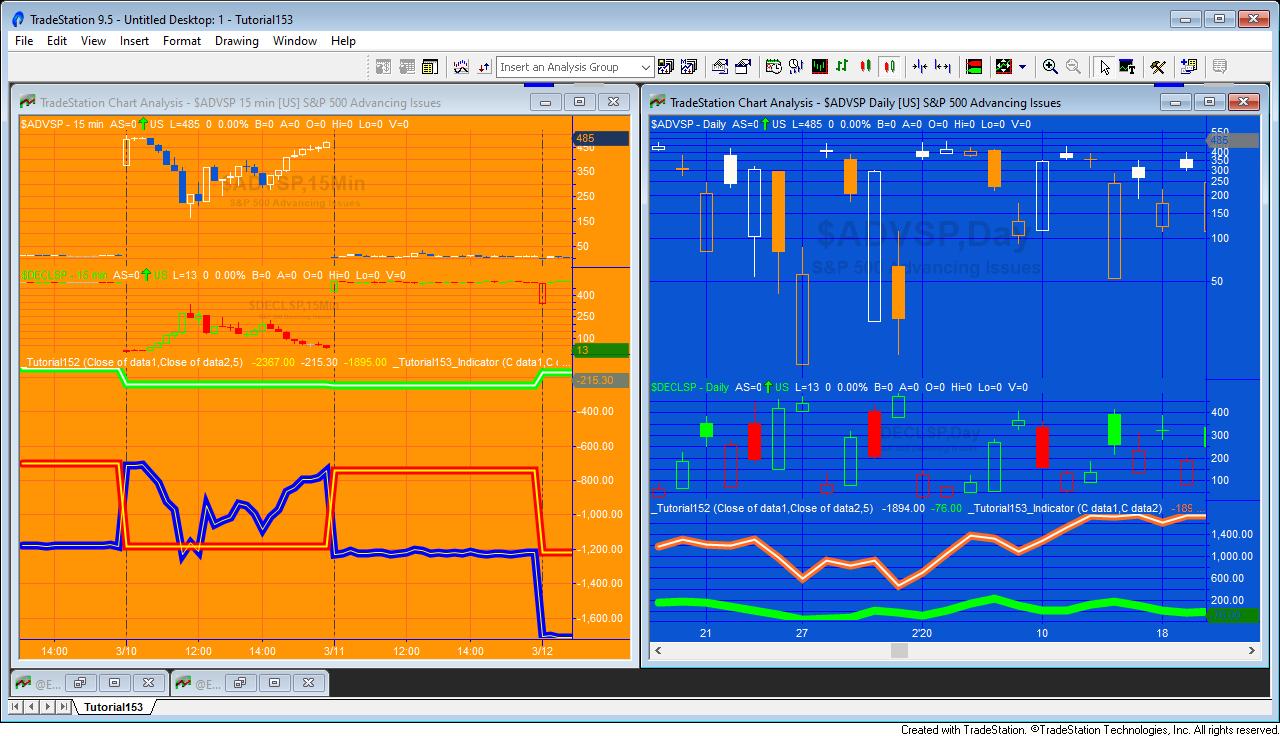
The values that were plotted by Tutorial 152 when applied to a minute interval chart. I then create a companion indicator (_Tutorial153_Indicator) that calls the function (_Tutorial153) and plots these values. The results are plotted on a chart and compared with the plots from Tutorial 152.
2. _Tutorial153_INPUT_EXAMPLES and _Tutorial153_INPUT_EXAMPLES_Indicator
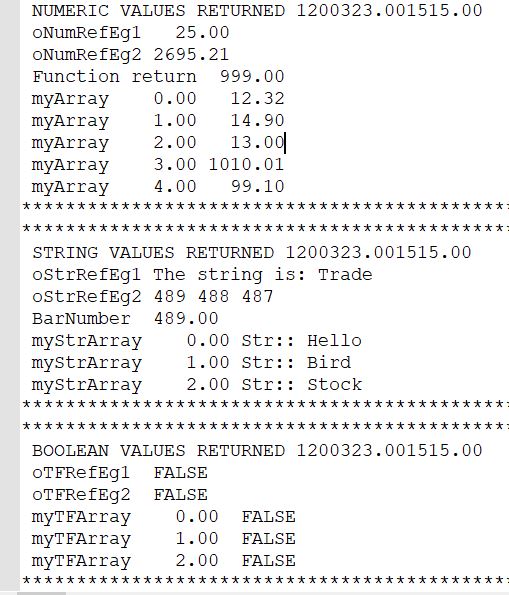
In part two I create another function (_Tutorial153_INPUT_EXAMPLES) that uses a lot of the syntax that could be found in any function. The function uses keywords such as: numericseries, numericsimple, numericarray, stringseries, stringsimple, truefalseseries, truefalsesimple, numericarrayref, stringarrayref, truefalsearrayref, numericref, stringref, and truefalseref. A companion indicator: _Tutorial153_INPUT_EXAMPLES_Indicator, calls the function.
_Tutorial153_INPUT_EXAMPLES and _Tutorial153_INPUT_EXAMPLES_Indicator are available in the Gold Pass area below.
Part 1 | _Tutorial153 (and _Tutorial153_Indicator)
To create a new function based on tutorial 152 I followed these steps (see the video below). Obviously, the procedure would be different for each indicator to varying degrees of complexity.
- Create new function
- Copy the _Tutorial152 indicator code into the function
- Remove Plot statements from the new function
- Add a return value using the same name as the funtion (i.e. _Tutorial153 = 1;)
- Move the variables containing values that we want to use as outputs, into the Inputs: area
- For the Numericseries inputs, delete the number and replace with Numericseries, e.g. AdvIssues( numericseries )
- For the Numericsimple inputs, delete the number and replace with Numericsimple, e.g. LRLength( numericsimple )
- For the outputs, replace the number with numericref, e.g. oMinCumulAdvDec( numericref )
The format of the indicator calling this function is:
Input: double AdvIssues( C data1 ),
double DecIssues( C data2 );

Vars: int oCumulVal( 0 ),
int oDayCumulVal( 0 ),
double oSlope( 0 );

Value1 = _Tutorial153( AdvIssues, DecIssues, 5, oCumulVal, oDayCumulVal, oSlope );

Plot1( oCumulVal );
If BarType = 1 then Plot2( oDayCumulVal );
Plot3( oSlope );
Video summary of tutorial 153 Part 1
Part 2 | _Tutorial153_INPUT_EXAMPLES and _Tutorial153_INPUT_EXAMPLES_Indicator
The second part of this tutorial is designed to show the syntax for creating functions with various type and inputs and outputs (numeric, string, true/false both series and simple as well as numeric, string and true/false arrays.
Video summary of tutorial 153 Part 2
All the _Tutorial153 tutorial functions and indicators (parts 1 and 2) are available for immediate download for $39.95. The download is a TradeStation ELD file that includes the unprotected and commented programs. These programs will work in MultiCharts.
Gold Pass area
If you are a Gold Pass member you can copy the code for _Tutorial153_INPUT_EXAMPLES and _Tutorial153_INPUT_EXAMPLES_Indicator below, please make sure that you are logged in with your Gold Pass user name and password.
![]() This content is for members only.
This content is for members only.
THESE INDICATORS, SHOW ME STUDIES, STRATEGIES AND OTHER PROGRAMS HAVE BEEN INCLUDED SOLELY FOR EDUCATIONAL PURPOSES.
TO THE BEST OF MARKPLEX CORPORATION’S KNOWLEDGE, ALL OF THE INFORMATION ON THIS PAGE IS CORRECT, AND IT IS PROVIDED IN THE HOPE THAT IT WILL BE USEFUL. HOWEVER, MARKPLEX CORPORATION ASSUMES NO LIABILITY FOR ANY DAMAGES, DIRECT OR OTHERWISE, RESULTING FROM THE USE OF THIS INFORMATION AND/OR PROGRAM(S) DESCRIBED, AND NO WARRANTY IS MADE REGARDING ITS ACCURACY OR COMPLETENESS. USE OF THIS INFORMATION AND/OR PROGRAMS DESCRIBED IS AT YOUR OWN RISK.
ANY EASYLANGUAGE OR POWERLANGUAGE TRADING STRATEGIES, SIGNALS, STUDIES, INDICATORS, SHOWME STUDIES, PAINTBAR STUDIES, PROBABILITYMAP STUDIES, ACTIVITYBAR STUDIES, FUNCTIONS (AND PARTS THEREOF) AND ASSOCIATED TECHNIQUES REFERRED TO, INCLUDED IN OR ATTACHED TO THIS TUTORIAL OR PROGRAM DESCRIPTION ARE EXAMPLES ONLY, AND HAVE BEEN INCLUDED SOLELY FOR EDUCATIONAL PURPOSES. MARKPLEX CORPORATION. DOES NOT RECOMMEND THAT YOU USE ANY SUCH TRADING STRATEGIES, SIGNALS, STUDIES, INDICATORS, SHOWME STUDIES, PAINTBAR STUDIES, PROBABILITYMAP STUDIES, ACTIVITYBAR STUDIES, FUNCTIONS (OR ANY PARTS THEREOF) OR TECHNIQUES. THE USE OF ANY SUCH TRADING STRATEGIES, SIGNALS, STUDIES, INDICATORS, SHOWME STUDIES, PAINTBAR STUDIES, PROBABILITYMAP STUDIES, ACTIVITYBAR STUDIES, FUNCTIONS AND TECHNIQUES DOES NOT GUARANTEE THAT YOU WILL MAKE PROFITS, INCREASE PROFITS, OR MINIMIZE LOSSES.