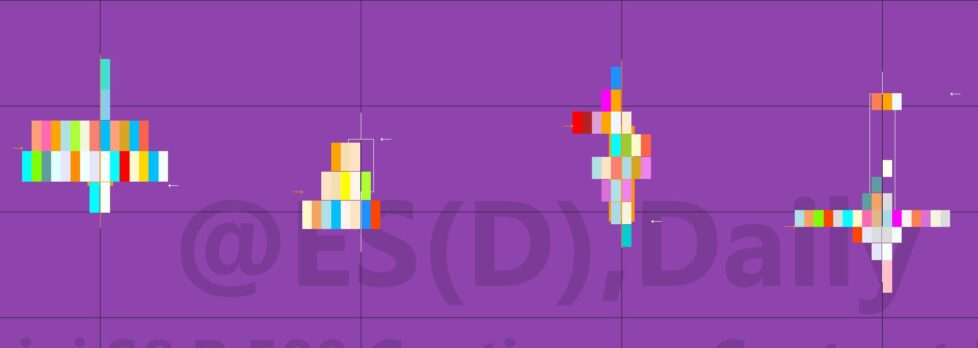
Tutorial 193 takes another look at TradeStation ActivityBar studies (see also Markplex tutorial 133.)
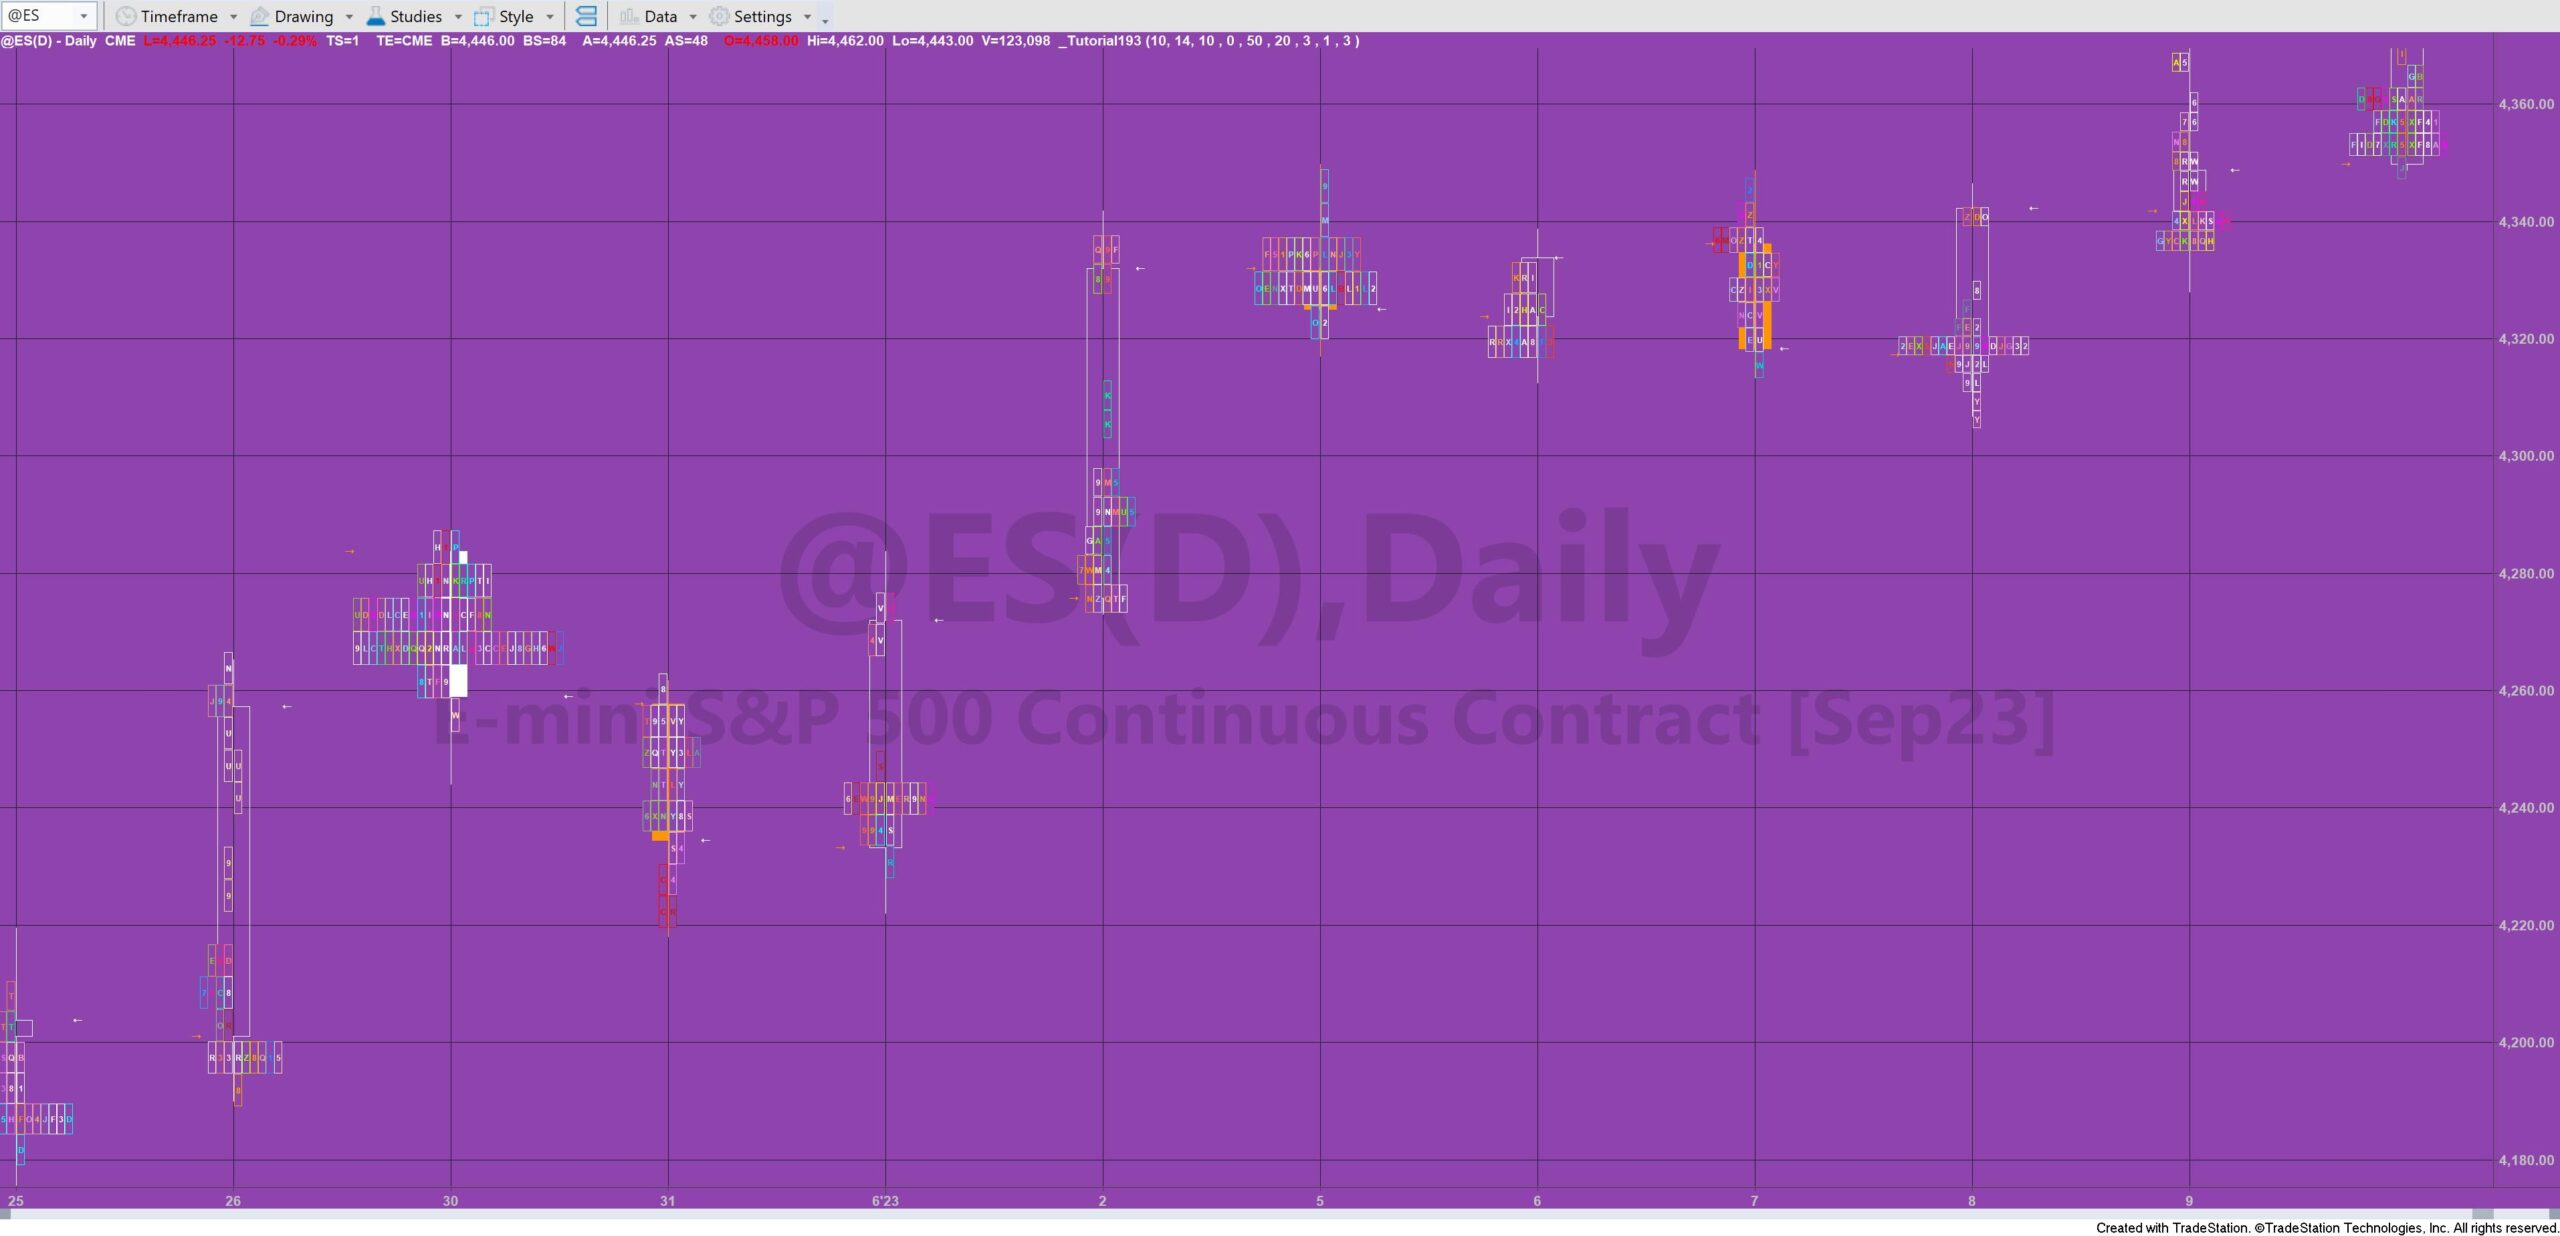
Activity bars allow the user to analyze a bar smaller than the current bar (known as the “activity bar”). In this tutorial the ‘big’ bars (data1) are set to daily, with the analysis being made on one minute bars (“activity bars”).
Specifically the tutorial analyzes the Commodity Channel Index (CCI) applied to the activity bars (one minute bars) and looks for “zero rejections” i.e. the CCI get close (or slightly crosses the zero line, depending on the inputs we use, but then moves back in the same directions it came from.
Tutorial 193 also looks for divergence between price and the CCI.
In either case, if an incidence of a zero rejection or a potential divergence occurs, an activity bars is drawn for the price range in which it occurred.
The tutorial includes two methods:
LegacyColorFromColObject: takes the name of a color and converts it into an integer which can be used in the AB_AddCellRange statement.
NewBar: this method is called for each activity bar. Most of the functionality is concerned with looking for divergences and zero rejections. If found AB_AddCellRange adds an activity bar. The method includes functionality to get a label value from a string. It also get the color value from a TokenList containing specific names of colors from the Color class.
Introduction to ActivityBars
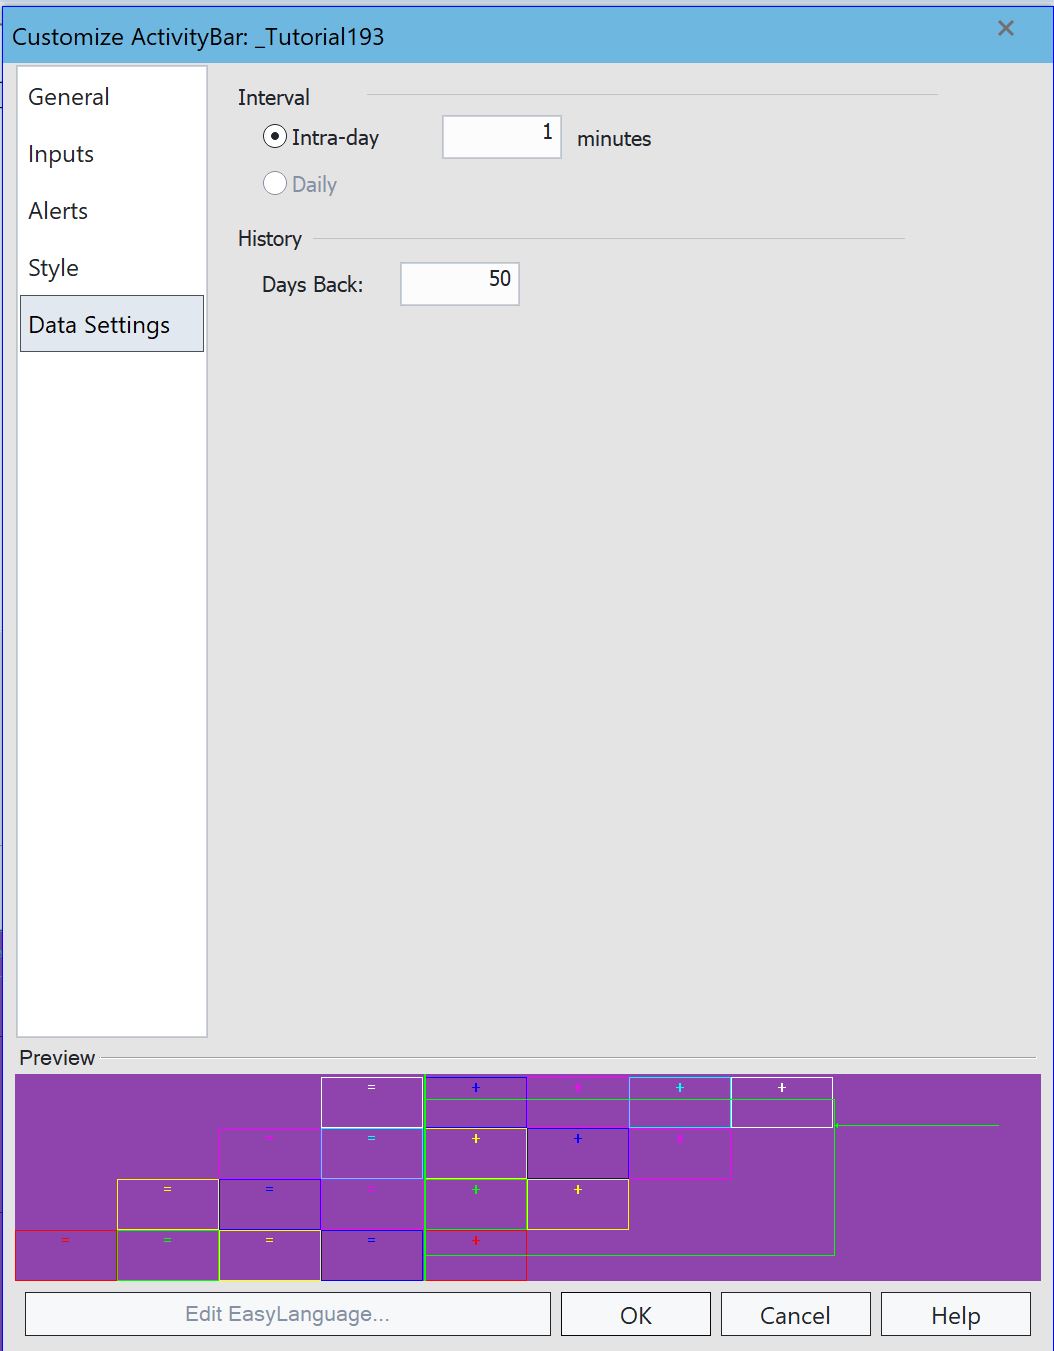
ActivityBar studies analyze bars based on look-inside-data of smaller ActivityBars. For example, a 30 minute bar might use 5 minute ActivityBars. ActivityBar studies uses ‘cells’ (little rectangles) to display information about a bar based on the range of prices for each underlying ActivityBar. The number of rows of cells can be controlled according to some other quantity related to the ActivityBar being analyzed.
The colors of the cells and the text within them can be changed for each ActivityBars.
The ApproxNumRows user input determines the approximate number of cell rows placed between the high and low prices of the ActivityBar.
Probably one of the simplest ActivityBar studies is the Price Distribution ActivityBar study which uses cells to show the range of prices for each ActivityBar interval within the price bar. The number of cells distributed on any one row or among several rows reveals in how many of the ActivityData intervals the price occurred.
TradeStation created a very good introduction to the functionality of its ActivityBar studies here: https://www.youtube.com/watch?v=j7kXbPjM7rU
Technical lessons include:
- Using data from the smaller time frame chart (activity data)
- Find when there is divergence in the activity bar data
- Look for CCI ‘zero rejections’using the activity bar data
- Modifying ActivityBar colors based on a list of Color objects stored in a TokenList
Explanation of tutorial 193

The tutorial is NOT compatible with MultiCharts.
TO THE BEST OF MARKPLEX CORPORATION’S KNOWLEDGE, ALL OF THE INFORMATION ON THIS PAGE IS CORRECT, AND IT IS PROVIDED IN THE HOPE THAT IT WILL BE USEFUL. HOWEVER, MARKPLEX CORPORATION ASSUMES NO LIABILITY FOR ANY DAMAGES, DIRECT OR OTHERWISE, RESULTING FROM THE USE OF THIS INFORMATION AND/OR PROGRAM(S) DESCRIBED, AND NO WARRANTY IS MADE REGARDING ITS ACCURACY OR COMPLETENESS. USE OF THIS INFORMATION AND/OR PROGRAMS DESCRIBED IS AT YOUR OWN RISK.
ANY EASYLANGUAGE OR POWERLANGUAGE TRADING STRATEGIES, SIGNALS, STUDIES, INDICATORS, SHOWME STUDIES, PAINTBAR STUDIES, PROBABILITYMAP STUDIES, ACTIVITYBAR STUDIES, FUNCTIONS (AND PARTS THEREOF) AND ASSOCIATED TECHNIQUES REFERRED TO, INCLUDED IN OR ATTACHED TO THIS TUTORIAL OR PROGRAM DESCRIPTION ARE EXAMPLES ONLY, AND HAVE BEEN INCLUDED SOLELY FOR EDUCATIONAL PURPOSES. MARKPLEX CORPORATION. DOES NOT RECOMMEND THAT YOU USE ANY SUCH TRADING STRATEGIES, SIGNALS, STUDIES, INDICATORS, SHOWME STUDIES, PAINTBAR STUDIES, PROBABILITYMAP STUDIES, ACTIVITYBAR STUDIES, FUNCTIONS (OR ANY PARTS THEREOF) OR TECHNIQUES. THE USE OF ANY SUCH TRADING STRATEGIES, SIGNALS, STUDIES, INDICATORS, SHOWME STUDIES, PAINTBAR STUDIES, PROBABILITYMAP STUDIES, ACTIVITYBAR STUDIES, FUNCTIONS AND TECHNIQUES DOES NOT GUARANTEE THAT YOU WILL MAKE PROFITS, INCREASE PROFITS, OR MINIMIZE LOSSES.


