

What is AVWAP?
Anchored Volume Weighted Average Price (AVWAP) is a tool that allows traders to calculate the average price of a security over a specified period, with the unique feature of anchoring the calculation to a specific event or time point. This anchoring feature sets it apart from the traditional Volume Weighted Average Price (VWAP), which calculates the average price over an entire trading session. Traders often use AVWAP to gain insights into how a security’s price and trading volume relate to specific events or milestones, such as earnings reports, economic announcements, or market openings.
When comparing AVWAP to VWAP, the main distinction is in their granularity. VWAP provides a broader view of the average price over the entire trading day, which is valuable for assessing the overall trend and market sentiment. On the other hand, AVWAP offers a more focused perspective, allowing traders to analyze price and volume dynamics in relation to specific events or timeframes. This makes AVWAP a potentially valuable tool for technical analysts looking to pinpoint moments of significance in the market and align their strategies accordingly.
Tutorial 198 demonstrates how to create an Anchored Volume Weighted Average Price (estimated) indicator that enables several AVWAP lines to be DRAWN on the same chart. This is achieved by using TradeStation drawing objects. The user holds down the Control button when clicking a bar and this draws an estimated AVWAP (and standard deviations). This can be repeated several times. These AWAP ‘trendlines’ remain on the chart until it is refreshed (Control-R), however, they are not updated as the chart develops.
If a bar is clicked without holding down the control key, the AVWAP is PLOTTED as it was in tutorial 192 and is updated as the chart develops. If another AVWAP is created using a control-click or click then any existing plot created by tutorial 198 is deleted and new lines plotted.
The Volume Weighted Average Price or VWAP is calculated by summing the volume multiplied by price, summing the volume and then dividing the former by the latter. This is an estimated value because the calculation is assuming that all the volume occurs at the ‘price’, by default this is set to the average price for the bar. The ‘anchored’ means that the line is calculated from the bar that was clicked (compared to being calculated from the beginning of the day, or the start of a new session).
This tutorial is not compatible with MultiCharts because it uses the Charting Host provider.
In the image below, the plot is made when a bar is clicked (these are the DodgerBlue and Gold lines). The lines drawn when a bar is clicked while the control key is held down are colored Salmon and SpringGreen.


Technical lessons include:
- How to clear a previous plot
- Detecting when a bar is clicked using the Charting Host
- ‘Maximum bars Study will reference’ and why the study is restarted when clicking older bars if the user detect option is selected
- Updating the plot for the bar currently being formed (and future bars)
- EasyLanguage reserved words related to Ticks and Volume
- Intrabarpersist variables
- Using a color object in a plot statement
- Drawing trendlines using drawing objects
- Storing values in vectors

Explanation of tutorial 198
Overview and summary of the tutorial code
Tutorial 198 demonstrates how to create a program to calculate and plot an “anchored” VWAP (Volume Weighted Average price.) It also shows how to detect if a control key is being held down while a bar is clicked and how to draw AVWAP lines and the associated standard deviations.
The tutorial uses the Charting Host to detect when a bar is clicked and the number of bars ago that the bar was clicked. With this information it firstly clears any Anchored VWAP that was previously plotted. It then, starting at the bar that was clicked, calculates and plots the Anchored VWAP.
The calculation is continued for real time bars for the plot but not for the drawing.
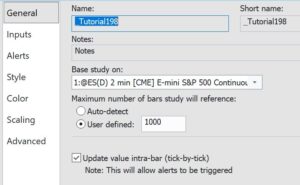 As was demonstrated in the video, the tutorial program can be used with “Maximum Number of Bars Study will Reference” set to user defined: 1000. For the chart data the number of bars to load was set to 2000.
Volume
The keyword ‘volume’ has many different meanings in TradeStation depending on what sort of chart you are using (and whether you have ‘for volume’ set to trade volume or tick count in the symbol settings).
If you open the program in the TDE (TradeStation Development Environment) and right click the keyword ‘volume’, and select ‘definition of volume’ you will see a link to “EasyLanguage Reserved Words Related to Ticks, Volume & Open Interest.” This provides detailed information in the various possible contexts.
As mentioned towards the end of video if the “Display Plot Value in Status Line, Datatip and Data Window” is selected as in the following window, spurious plot values will be shown for areas of the chart where plots were made previously but now no longer exist (see example chart below).

Users need to be aware of this ‘feature’ or deselect “Display Plot Value in Status Line, Datatip and Data Window” as demonstrated in the video.
The tutorial is NOT compatible with MultiCharts.
Colors
| AliceBlue | DarkSlateGray | LightSalmon | PaleVioletRed |
| AntiqueWhite | DarkTurquoise | LightSeaGreen | PapayaWhip |
| Aqua | DarkViolet | LightSkyBlue | PeachPuff |
| Aquamarine | DeepPink | LightSlateGray | Peru |
| Azure | DeepSkyBlue | LightSteelBlue | Pink |
| Beige | DimGray | LightYellow | Plum |
| Bisque | DodgerBlue | Lime | PowderBlue |
| Black | Firebrick | LimeGreen | Purple |
| BlanchedAlmond | FloralWhite | Linen | Red |
| Blue | ForestGreen | Magenta | RosyBrown |
| BlueViolet | Fuschia | Maroon | RoyalBlue |
| Brown | Gainsboro | MediumAquamarine | SaddleBrown |
| Burlywood | GhostWhite | MediumBlue | Salmon |
| CadetBlue | Gold | MediumOrchid | SandyBrown |
| Chartreuse | Goldenrod | MediumPurple | SeaGreen |
| Chocolate | Gray | MediumSeaGreen | Seashell |
| Coral | Green | MediumSlateBlue | Sienna |
| CornflowerBlue | GreenYellow | MediumSpringGreen | Silver |
| Cornsilk | Honeydew | MediumTurquoise | SkyBlue |
| Cyan | HotPink | MediumVioletRed | SlateBlue |
| DarkBlue | IndianRed | MidnightBlue | SlateGray |
| DarkBrown | Indigo | MintCream | Snow |
| DarkCyan | Ivory | MistyRose | SpringGreen |
| DarkGoldenrod | Khaki | Moccasin | SteelBlue |
| DarkGray | Lavender | NavajoWhite | Tan |
| DarkGreen | LavenderBlush | Navy | Teal |
| DarkKhaki | LawnGreen | OldLace | Thistle |
| Dark Magenta | LemonChiffon | Olive | Tomato |
| DarkOliveGreen | LightBlue | OliveDrab | Turquoise |
| DarkOrange | LightCoral | Orange | Violet |
| DarkOrchid | LightCyan | OrangeRed | Wheat |
| DarkRed | LightGoldenrodYellow | Orchid | White |
| DarkSalmon | LightGray | PaleGoldenrod | WhiteSmoke |
| DarkSeaGreen | LightGreen | PaleGreen | Yellow |
| DarkSlateBlue | LightPink | PaleTurquoise | YellowGreen |
TO THE BEST OF MARKPLEX CORPORATION’S KNOWLEDGE, ALL OF THE INFORMATION ON THIS PAGE IS CORRECT, AND IT IS PROVIDED IN THE HOPE THAT IT WILL BE USEFUL. HOWEVER, MARKPLEX CORPORATION ASSUMES NO LIABILITY FOR ANY DAMAGES, DIRECT OR OTHERWISE, RESULTING FROM THE USE OF THIS INFORMATION AND/OR PROGRAM(S) DESCRIBED, AND NO WARRANTY IS MADE REGARDING ITS ACCURACY OR COMPLETENESS. USE OF THIS INFORMATION AND/OR PROGRAMS DESCRIBED IS AT YOUR OWN RISK.
ANY EASYLANGUAGE OR POWERLANGUAGE TRADING STRATEGIES, SIGNALS, STUDIES, INDICATORS, SHOWME STUDIES, PAINTBAR STUDIES, PROBABILITYMAP STUDIES, ACTIVITYBAR STUDIES, FUNCTIONS (AND PARTS THEREOF) AND ASSOCIATED TECHNIQUES REFERRED TO, INCLUDED IN OR ATTACHED TO THIS TUTORIAL OR PROGRAM DESCRIPTION ARE EXAMPLES ONLY, AND HAVE BEEN INCLUDED SOLELY FOR EDUCATIONAL PURPOSES. MARKPLEX CORPORATION. DOES NOT RECOMMEND THAT YOU USE ANY SUCH TRADING STRATEGIES, SIGNALS, STUDIES, INDICATORS, SHOWME STUDIES, PAINTBAR STUDIES, PROBABILITYMAP STUDIES, ACTIVITYBAR STUDIES, FUNCTIONS (OR ANY PARTS THEREOF) OR TECHNIQUES. THE USE OF ANY SUCH TRADING STRATEGIES, SIGNALS, STUDIES, INDICATORS, SHOWME STUDIES, PAINTBAR STUDIES, PROBABILITYMAP STUDIES, ACTIVITYBAR STUDIES, FUNCTIONS AND TECHNIQUES DOES NOT GUARANTEE THAT YOU WILL MAKE PROFITS, INCREASE PROFITS, OR MINIMIZE LOSSES.