- If the update is NOT a trade, and the update is a bid, the bid price is stored in an intrabarpersist variable (LastBidPrice) and the datetime is stored
- If the update is NOT a trade, and the update is an ask, the ask price is stored in an intrabarpersist variable (LastAskPrice) and the datetime is stored
- If the update IS a trade, the size of the trade (number of contracts or shares) is compared with a variable that keeps a record of the biggest trade, so far, that bar. If the size of the trade is bigger than this number then the variable is updated. The datetime is stored
- If the update is a trade, and its price is less than or equal to the last bid price then TradeBidCount is incremented. The time of the trade is stored in Datetime format.
- If the update is a trade, and its price is greater or equal to the latest ask price then TradeAskCount is incremented. The time of the trade is stored in Datetime format.
- The spread is very tight (e.g., 1 tick)
- The market is moving fast (quotes and trades may not align perfectly)
- There’s price improvement (e.g., a buyer gets filled between the bid and ask)
- A trade occurs inside the spread (e.g., midpoint fills).
Comments
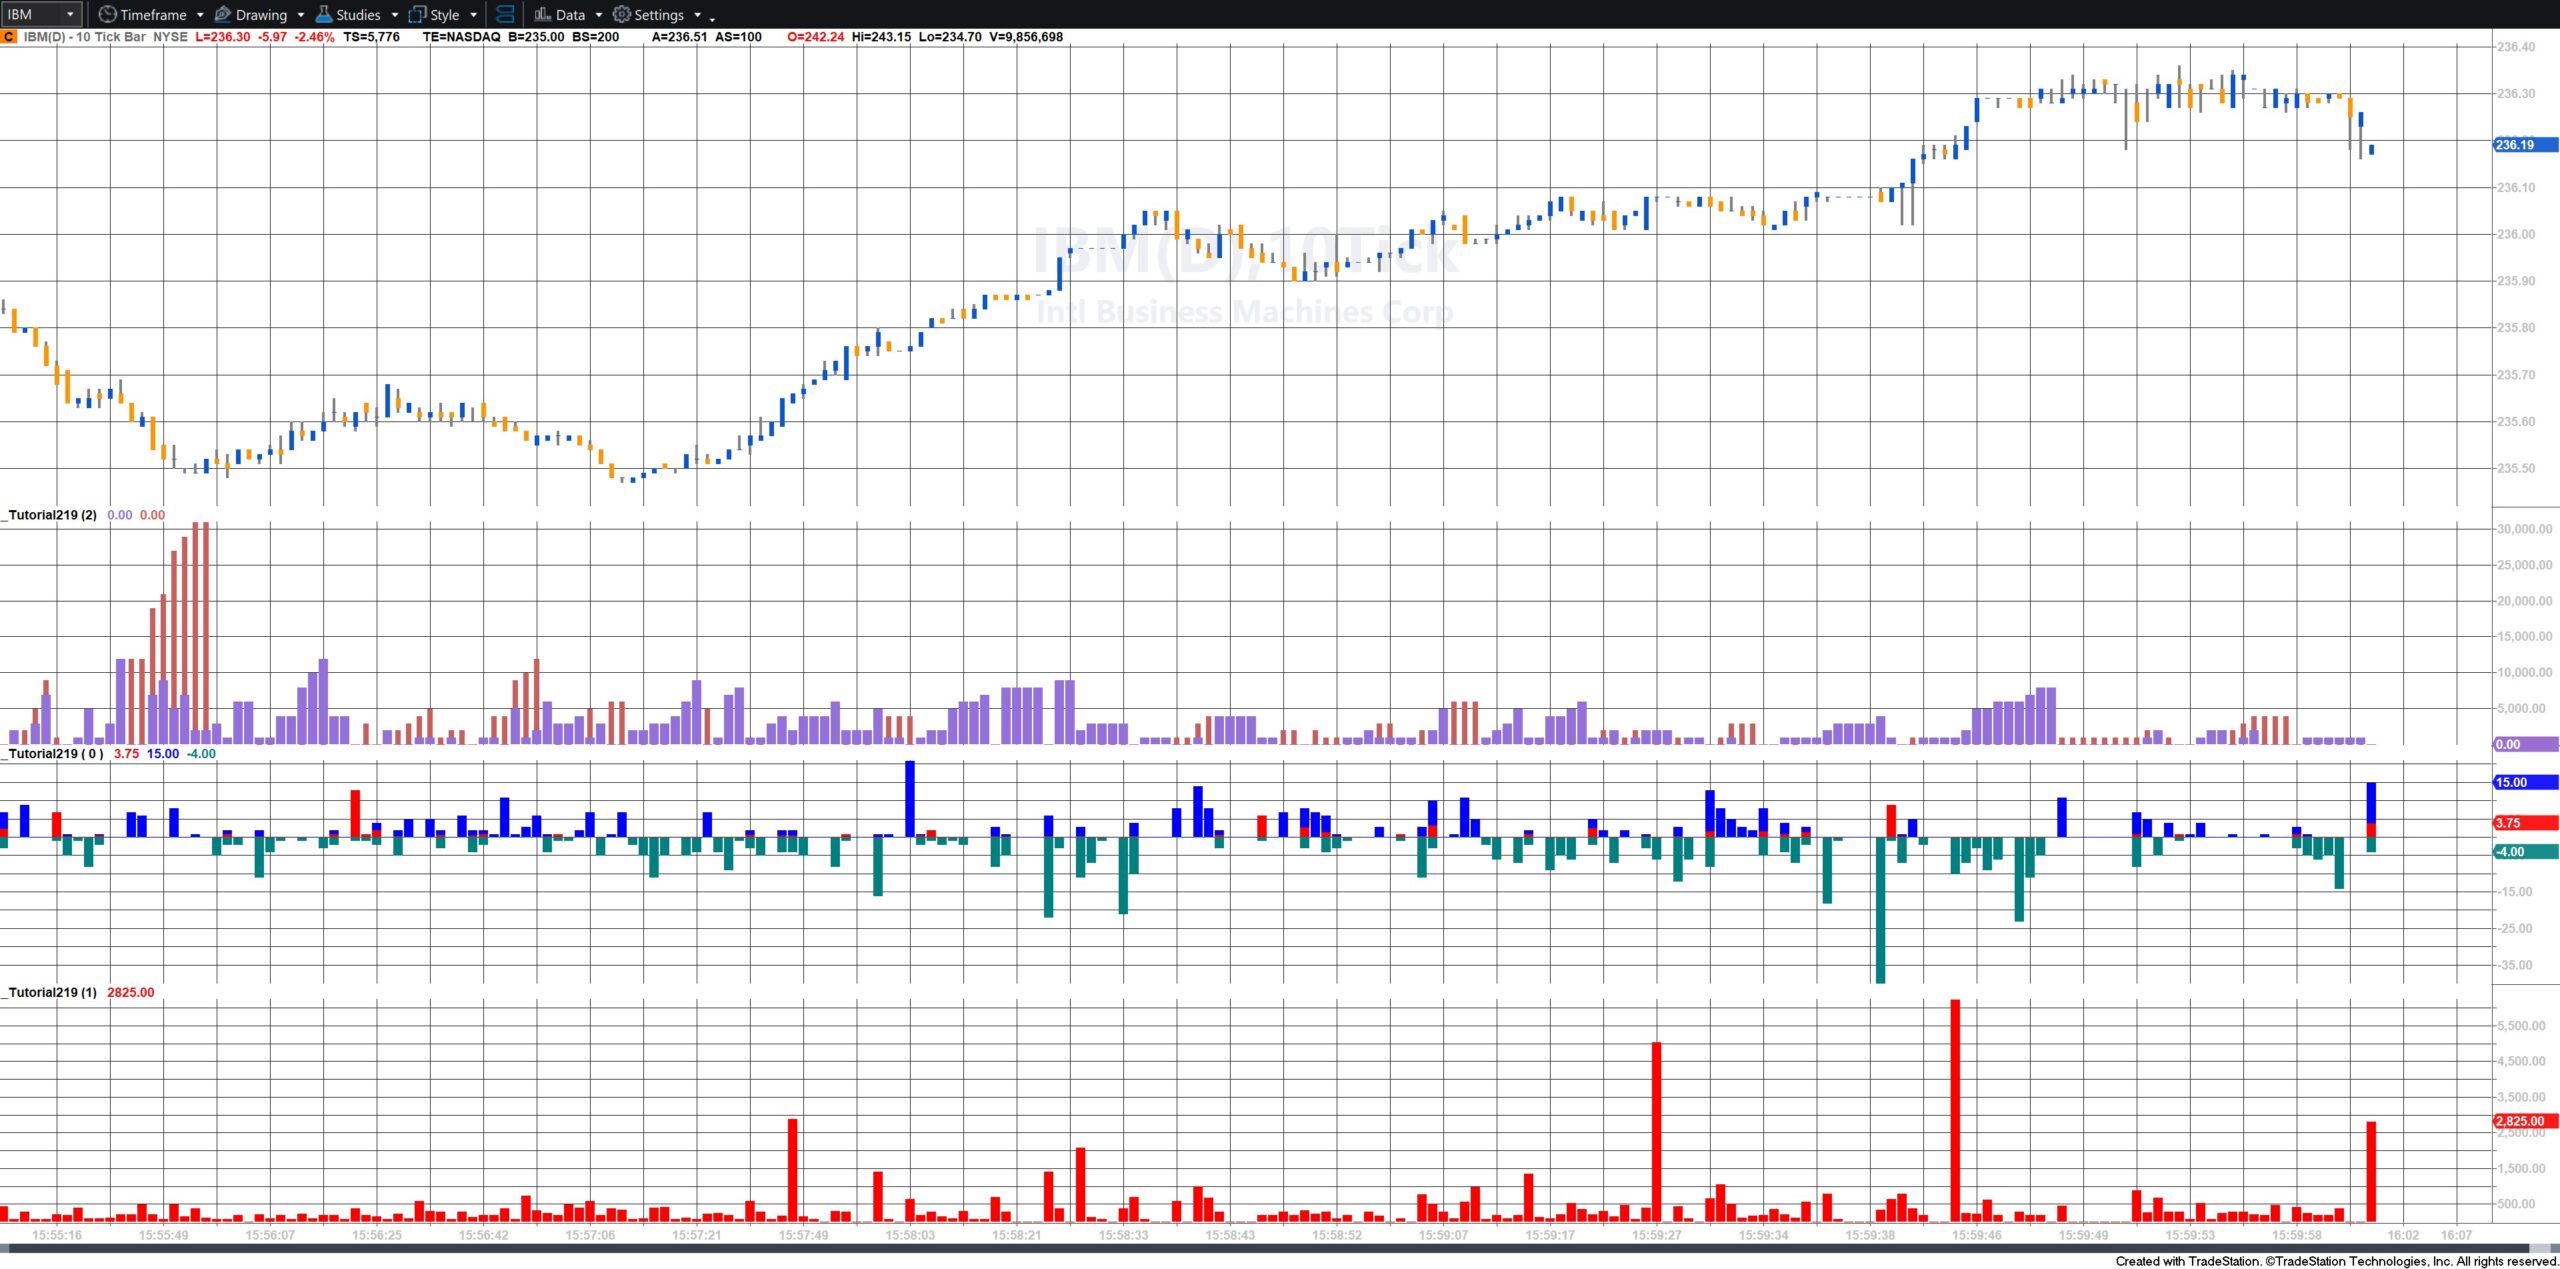
- The ratio of the number of trades made at the bid price divided by the number trades made at the ask price
- The number of trades made at the bid price
- The number trades made at the ask price
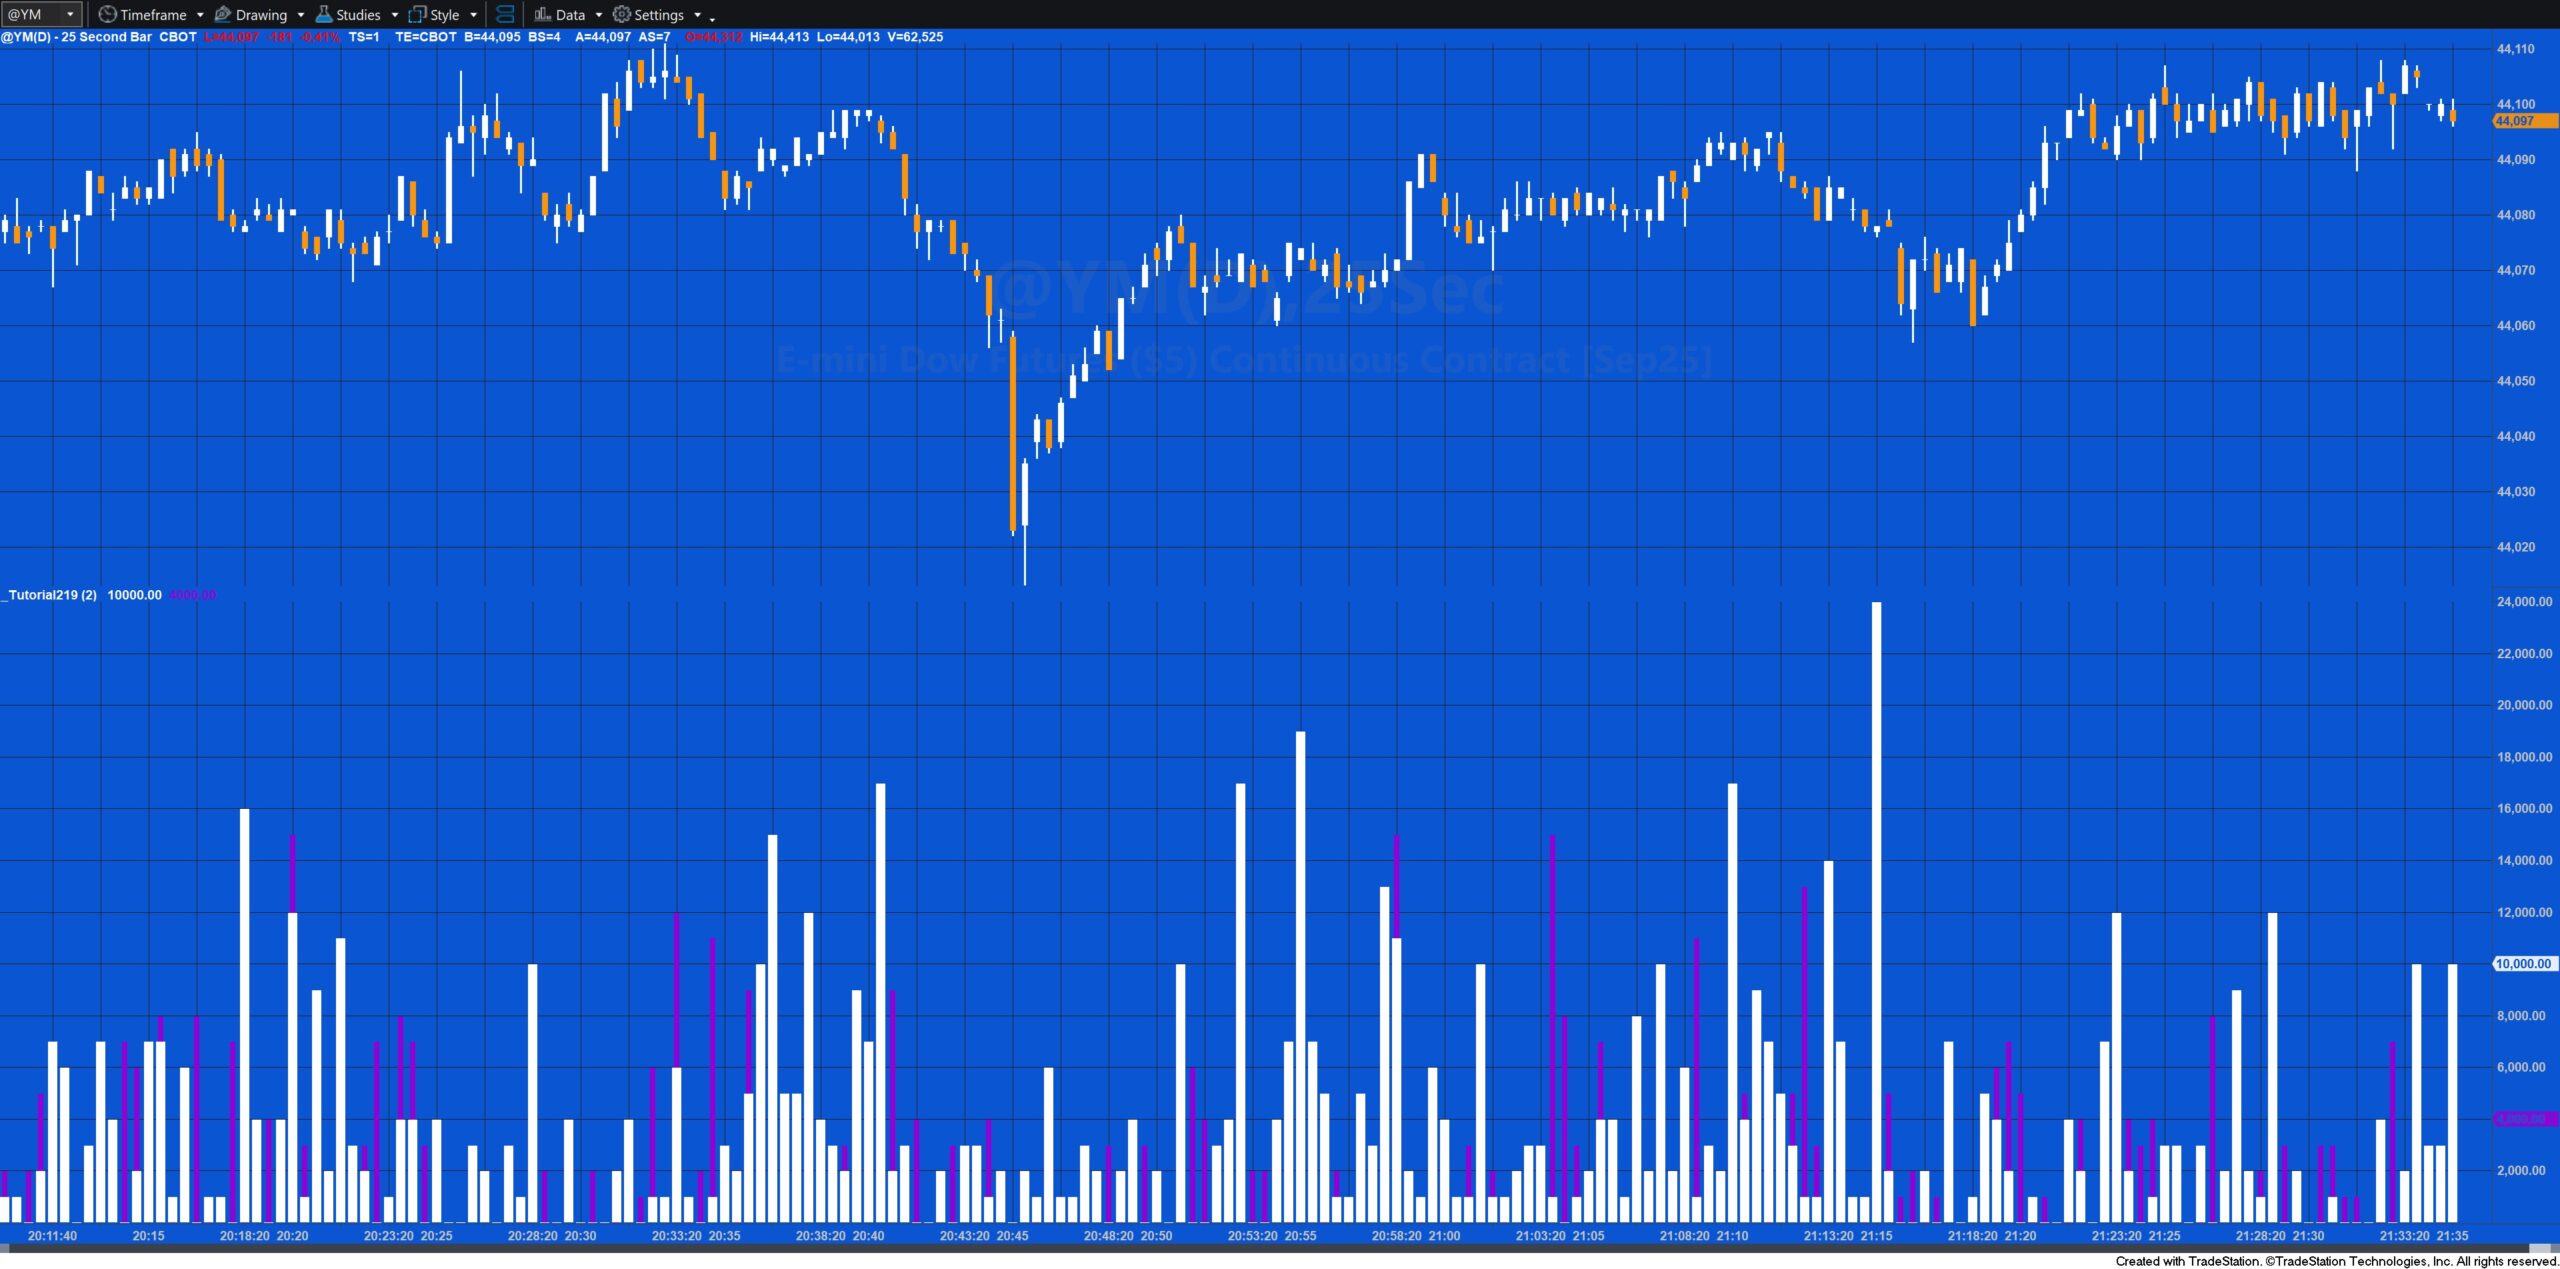
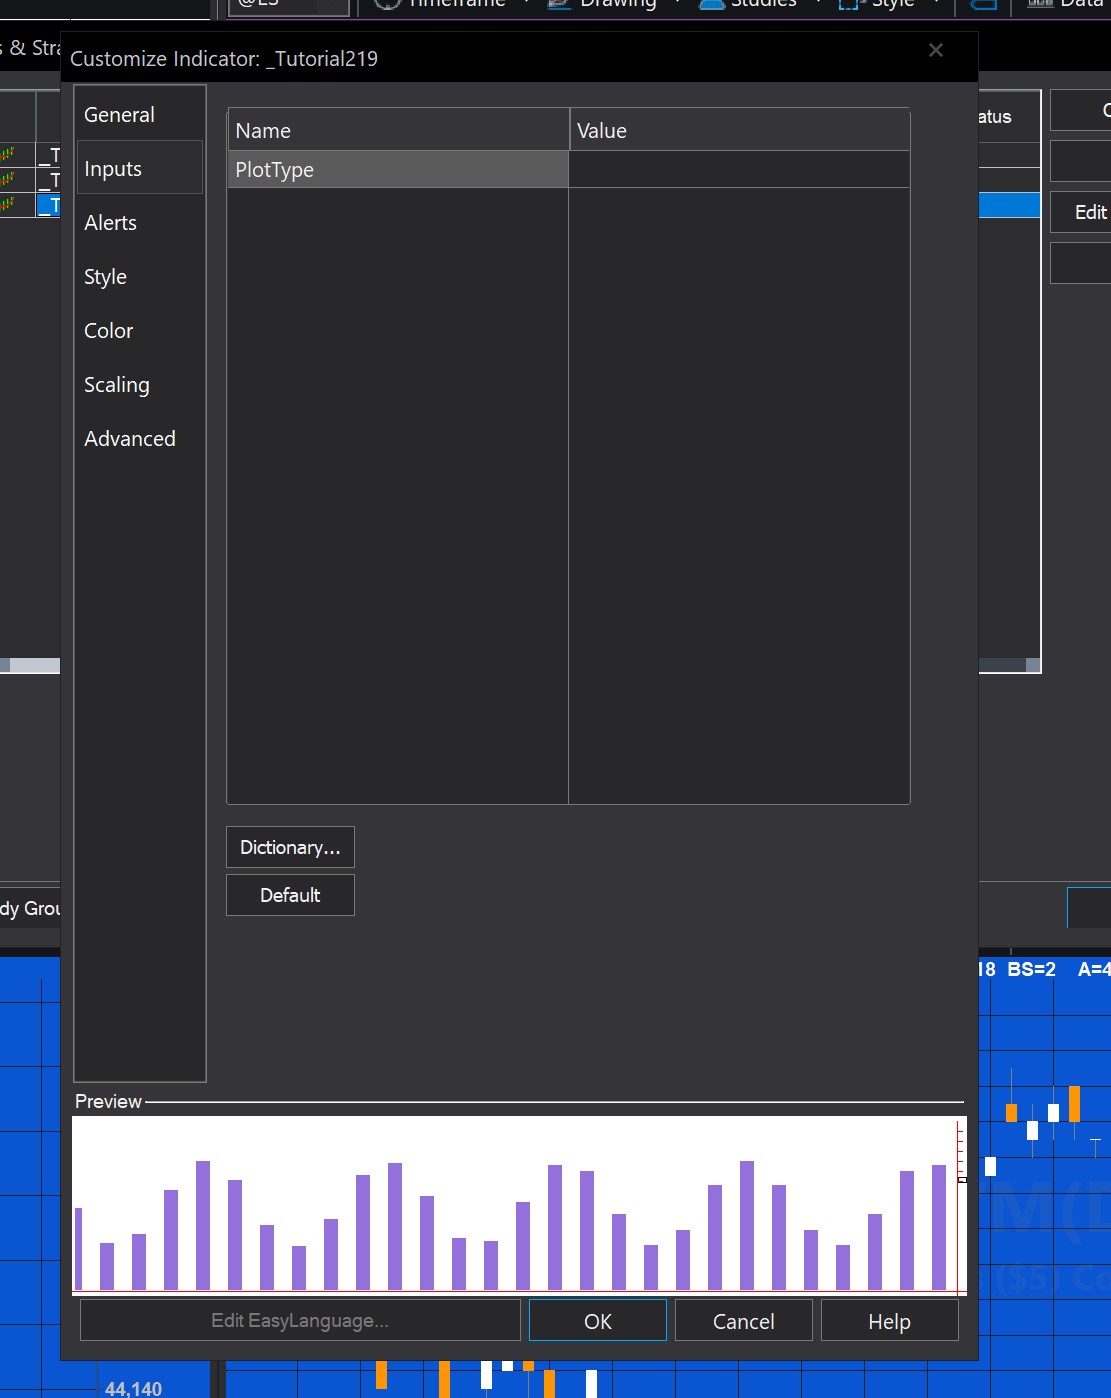
If the PlotType input is set to 1:
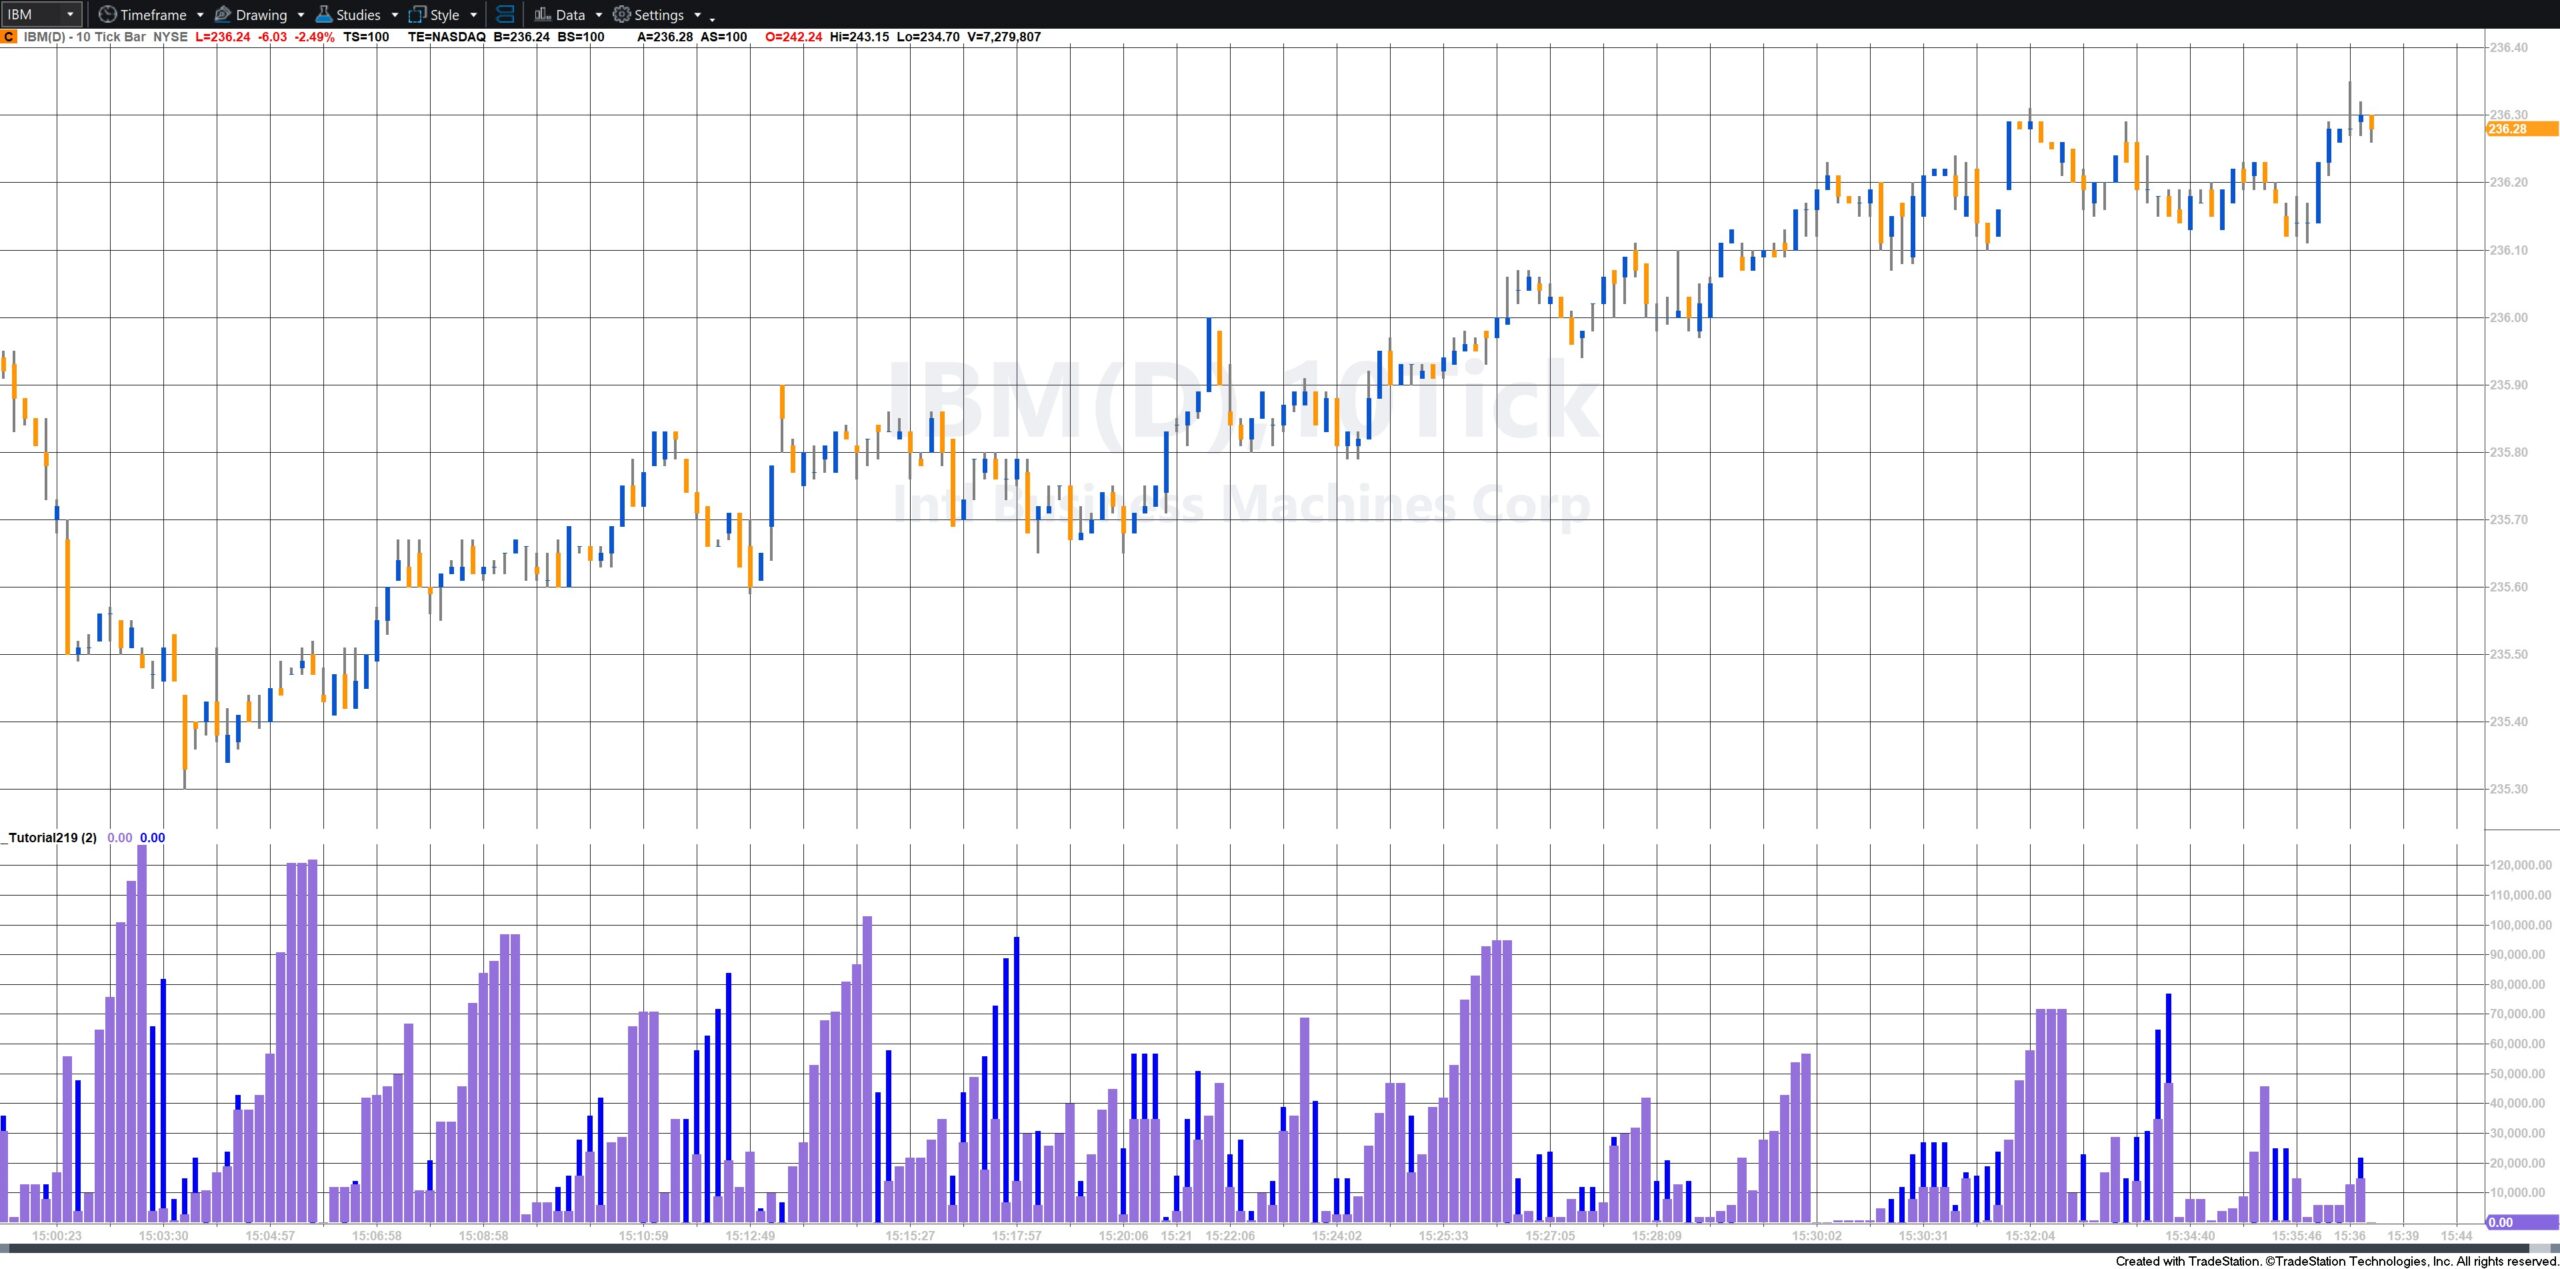
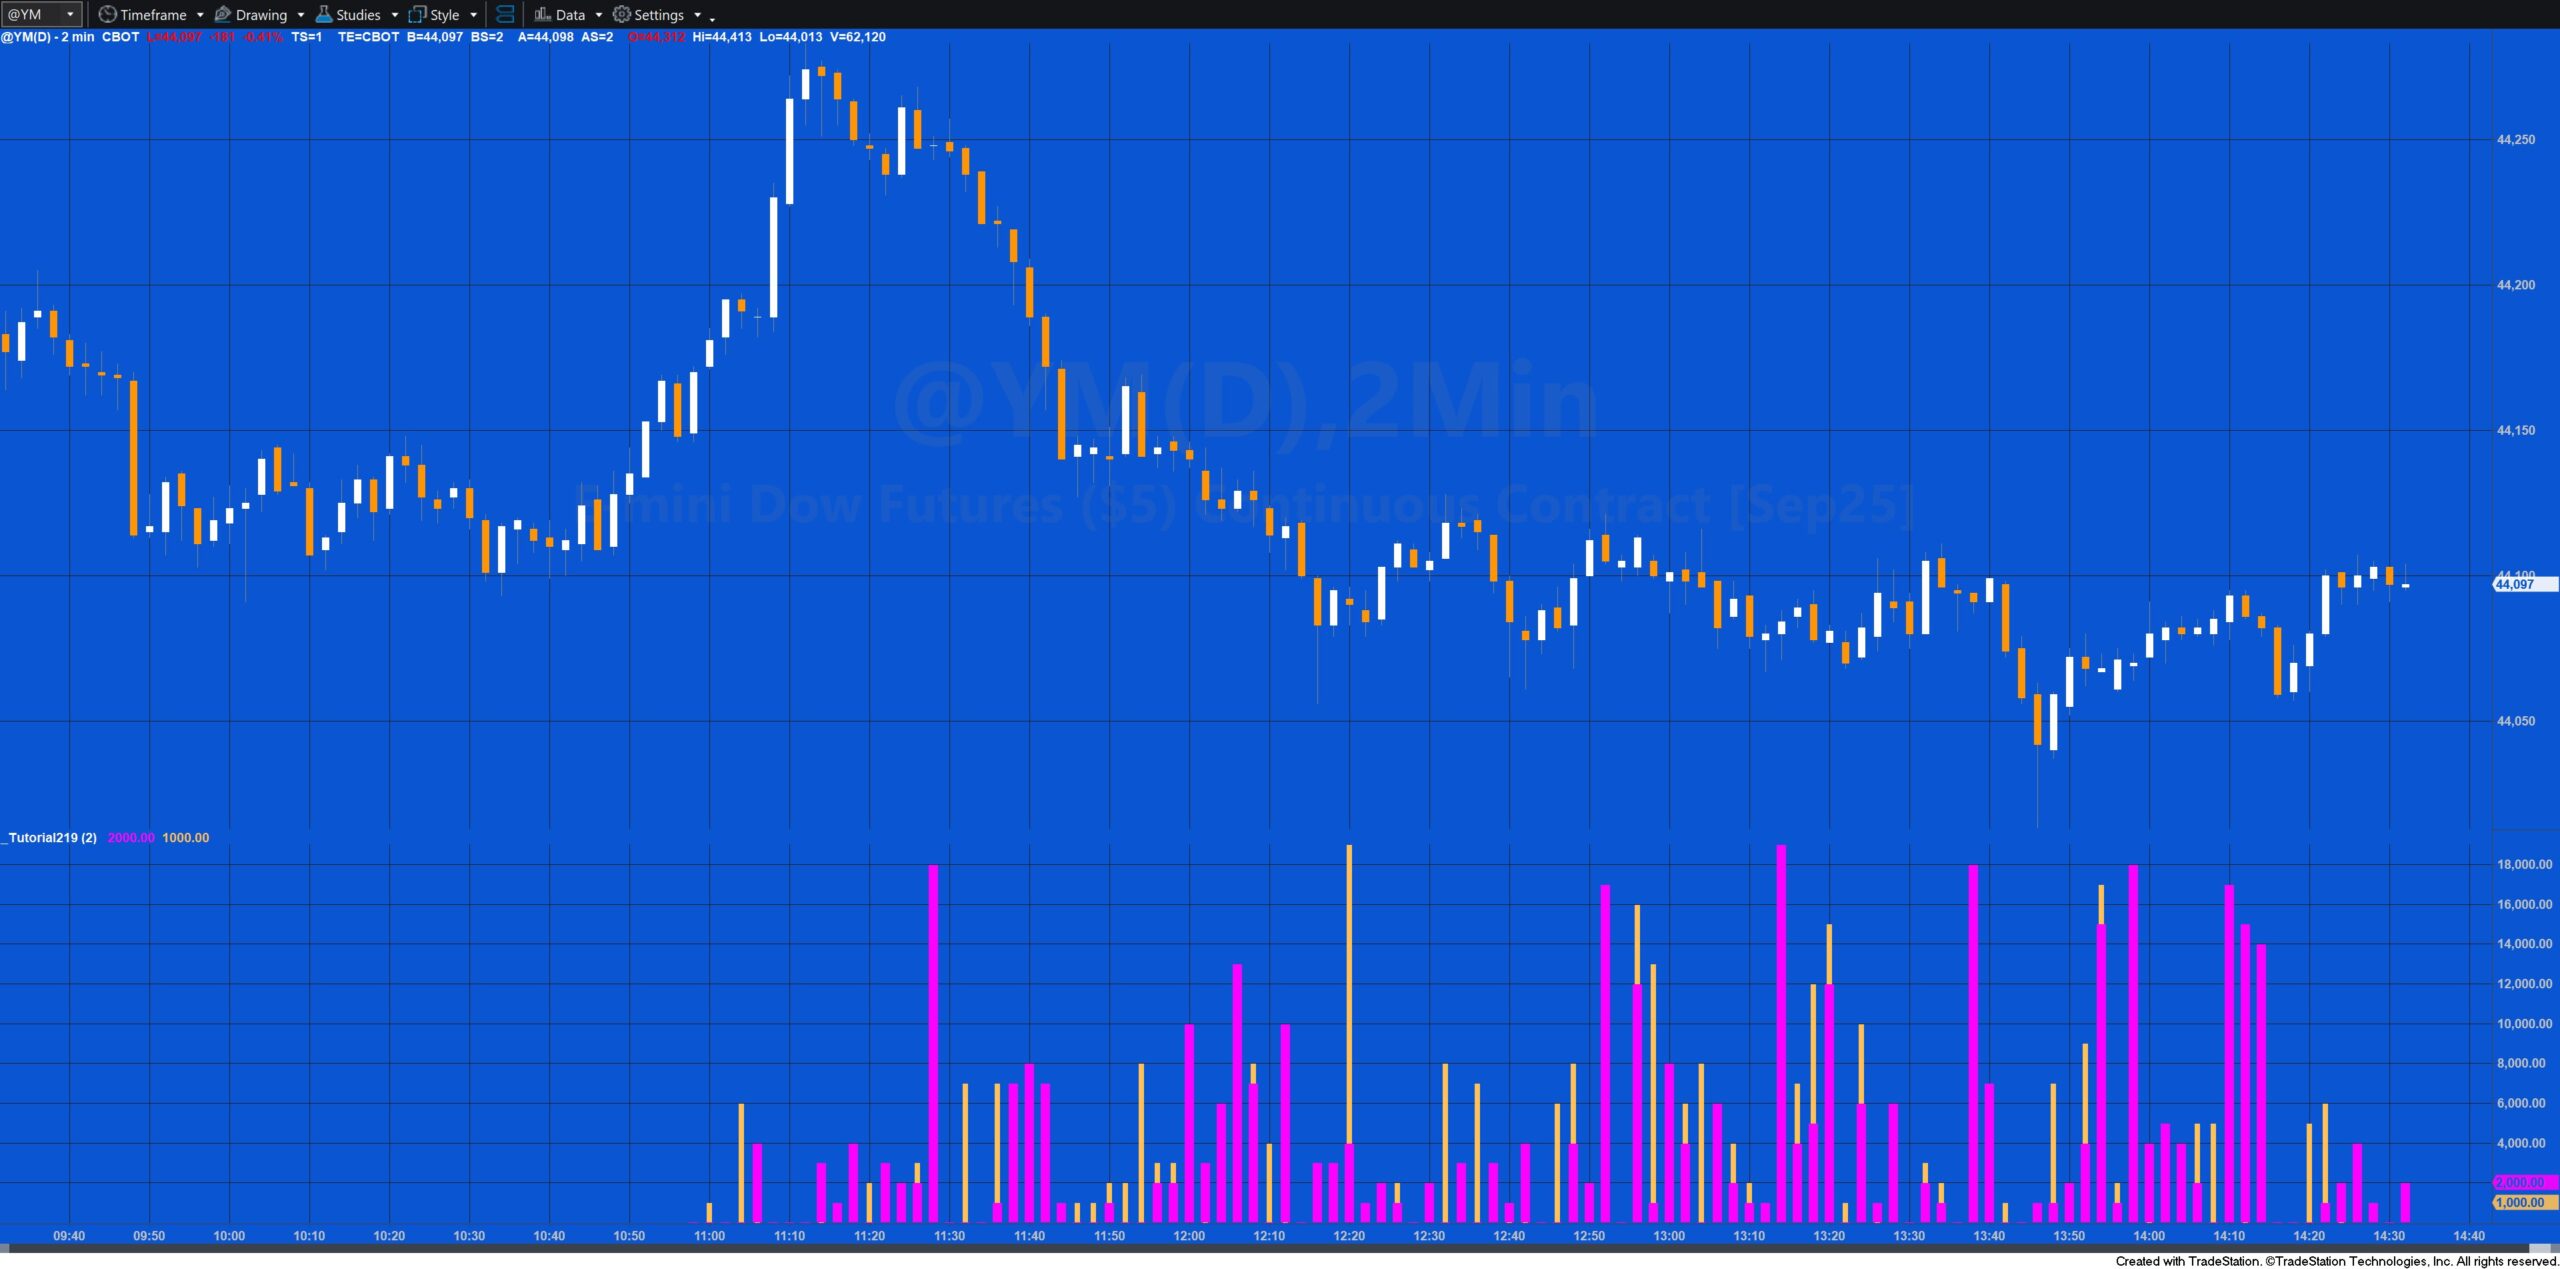
- The largest trade, by volume, for the bar
If the PlotType input is set to 2:
- The approximate time since the last trade at the bid price
- The approximate time since the last trade at the ask price
Tutorial 219 is a latency-style measure of order flow activity at each side of the book, and it could potentially give insight into short-term supply/demand shifts that traditional indicators can’t show.
Here are some potential uses:
1. Order Flow Momentum
-
If the “time since last trade at bid” is rapidly increasing while “time since last trade at ask” is low, it means:
-
Trades at the bid are drying up (buyers aren’t hitting the bid).
-
Trades at the ask are happening frequently (buyers are aggressive).
-
This could indicate bullish short-term sentiment.
-
-
Reverse logic for bearish setups.
2. Detecting Microstructural Stalls
-
In very short timeframes (e.g., sub-second), if both counters suddenly freeze (no trades at bid or ask), it can signal:
-
A liquidity vacuum before a breakout.
-
An impending large order sweep.
-
High-Frequency Trading (HFT) activity pausing to reassess.
-
3. Trade Aggression / Passive Side Fatigue
-
A consistently short “time since last trade” at one side suggests aggressive activity there.
-
A long gap indicates passive liquidity is holding, and that side is not getting hit/lifted.
-
This can help spot when a price level is about to be broken because one side is no longer defended.
4. Filtering False Moves
-
Price can tick up on thin volume, but if the ask-trade timer stays high (few trades hitting the ask), the move might be weak.
-
Similarly, a tick down without active bid-trade pressure might be just noise.
5. Spread Behavior and Microtrend Confirmation
-
By combining the bid/ask timers with spread width and tick direction, you can confirm whether a microtrend is supported by aggressive trading in the direction of the move.
6. Scalping / HFT-style Triggers
-
A strategy could fire when:
-
“Ask trade time” < X ms (continuous aggressive buying)
-
AND “Bid trade time” > Y ms (no aggressive selling)
-
AND price is near a key breakout level.
-
Explanation of tutorial 219
Download the tutorial 219 program
If you wish to save yourself some typing, the tutorial programs are available for immediate download by clicking the ‘add to cart’ button below. You may pay using PayPal or a credit card. The price is $34.95
TO THE BEST OF MARKPLEX CORPORATION’S KNOWLEDGE, ALL OF THE INFORMATION ON THIS PAGE IS CORRECT, AND IT IS PROVIDED IN THE HOPE THAT IT WILL BE USEFUL. HOWEVER, MARKPLEX CORPORATION ASSUMES NO LIABILITY FOR ANY DAMAGES, DIRECT OR OTHERWISE, RESULTING FROM THE USE OF THIS INFORMATION AND/OR PROGRAM(S) DESCRIBED, AND NO WARRANTY IS MADE REGARDING ITS ACCURACY OR COMPLETENESS. USE OF THIS INFORMATION AND/OR PROGRAMS DESCRIBED IS AT YOUR OWN RISK.
ANY EASYLANGUAGE OR POWERLANGUAGE TRADING STRATEGIES, SIGNALS, STUDIES, INDICATORS, SHOWME STUDIES, PAINTBAR STUDIES, PROBABILITYMAP STUDIES, ACTIVITYBAR STUDIES, FUNCTIONS (AND PARTS THEREOF) AND ASSOCIATED TECHNIQUES REFERRED TO, INCLUDED IN OR ATTACHED TO THIS TUTORIAL OR PROGRAM DESCRIPTION ARE EXAMPLES ONLY, AND HAVE BEEN INCLUDED SOLELY FOR EDUCATIONAL PURPOSES. MARKPLEX CORPORATION. DOES NOT RECOMMEND THAT YOU USE ANY SUCH TRADING STRATEGIES, SIGNALS, STUDIES, INDICATORS, SHOWME STUDIES, PAINTBAR STUDIES, PROBABILITYMAP STUDIES, ACTIVITYBAR STUDIES, FUNCTIONS (OR ANY PARTS THEREOF) OR TECHNIQUES. THE USE OF ANY SUCH TRADING STRATEGIES, SIGNALS, STUDIES, INDICATORS, SHOWME STUDIES, PAINTBAR STUDIES, PROBABILITYMAP STUDIES, ACTIVITYBAR STUDIES, FUNCTIONS AND TECHNIQUES DOES NOT GUARANTEE THAT YOU WILL MAKE PROFITS, INCREASE PROFITS, OR MINIMIZE LOSSES.

