

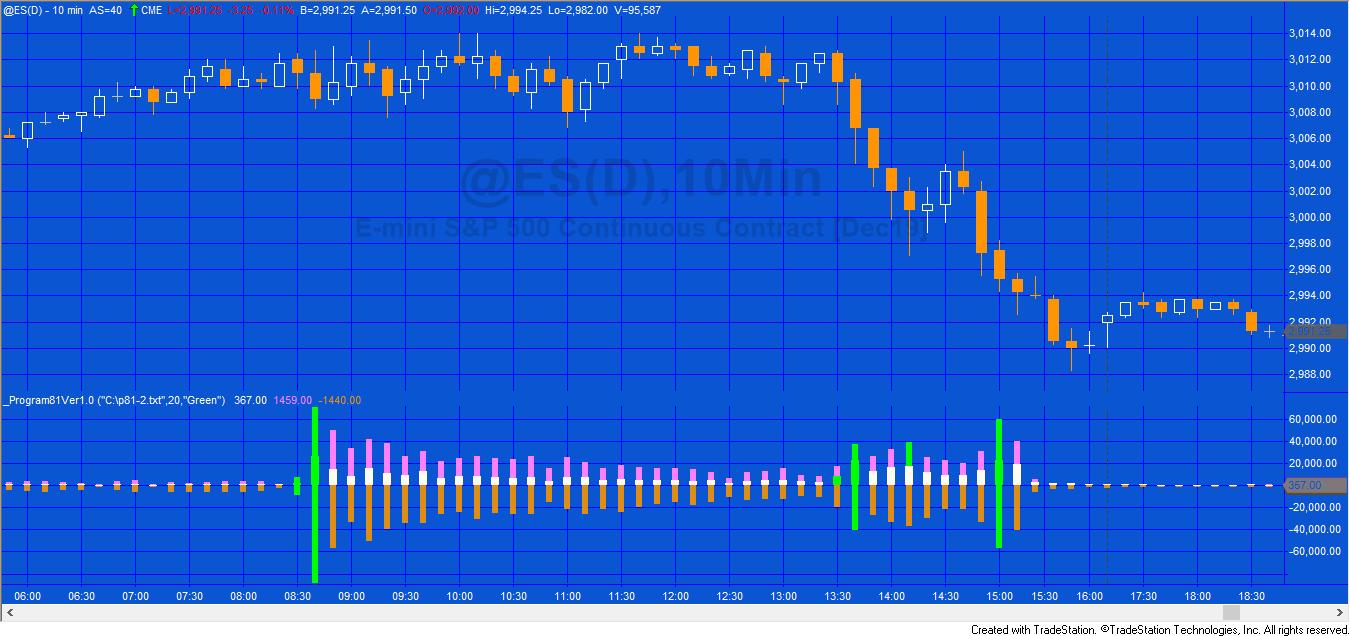
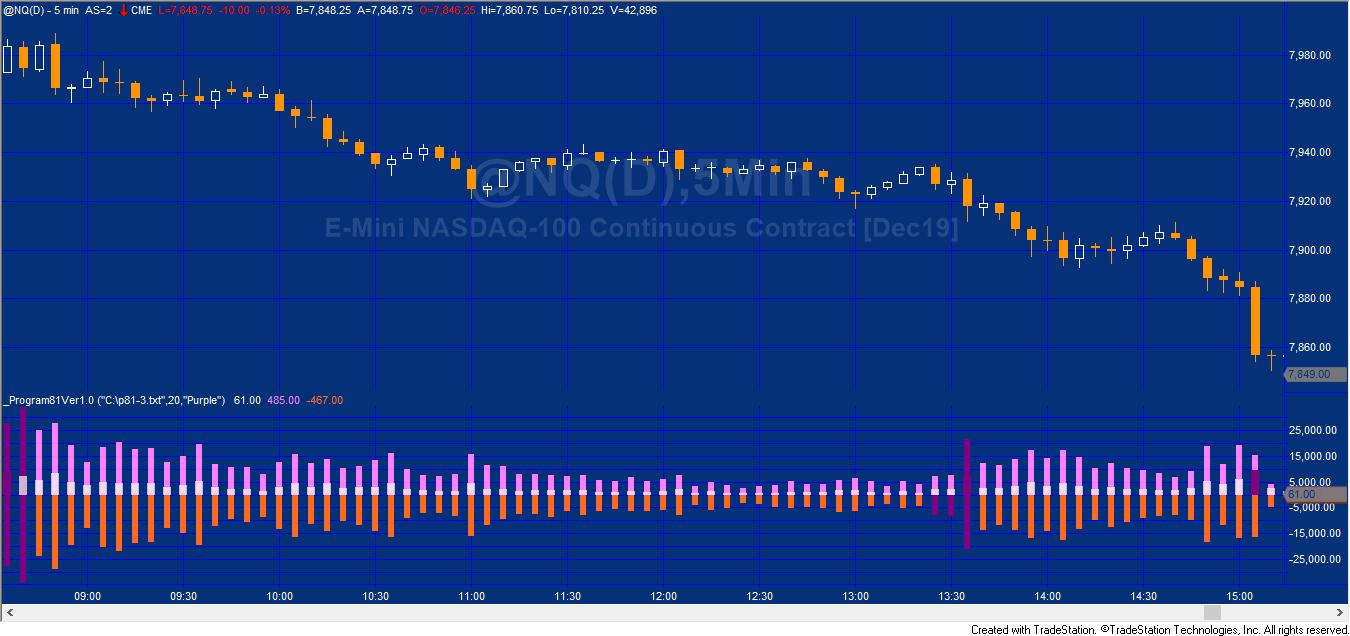
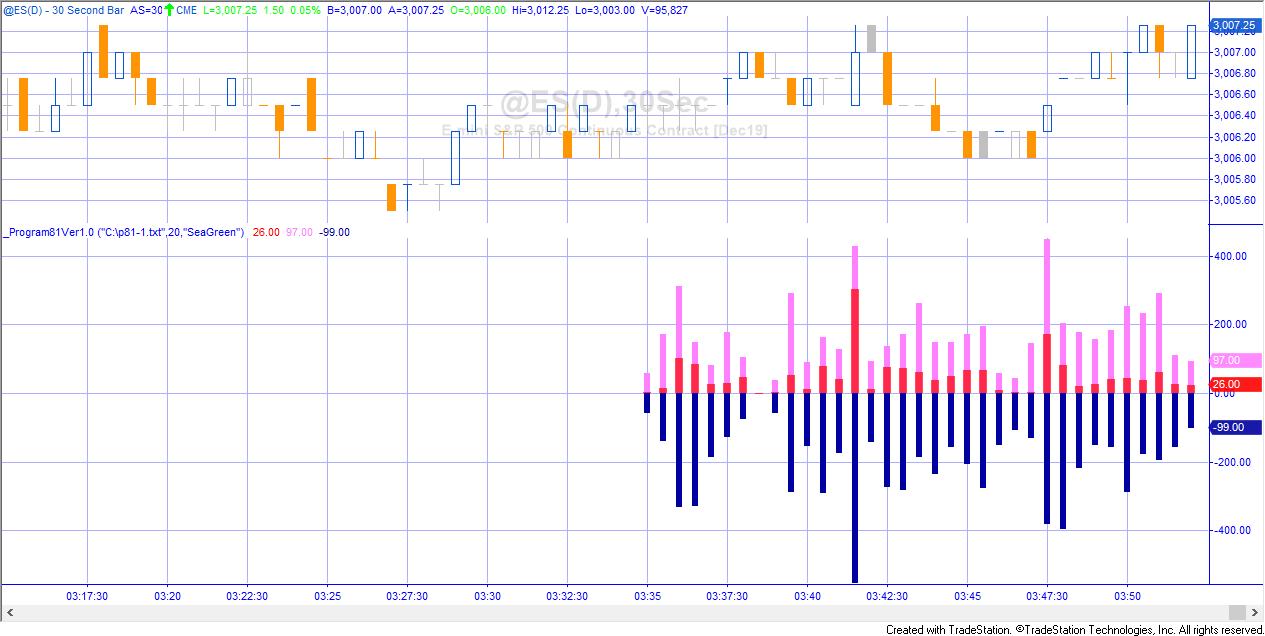
Program 81 uses a time and sales provider to analyze trade information and plot the number of trades, asks, and bids per bar. The program is simpler than program 80 but uses some of the same techniques, so if you are interested in the Time and Sales provider this program should get you started. The program is fully commented.
In program 81 the number of trades and bids are plotted as positive numbers, the number of asks as a negative number. Time and Sales data is not available historically in TradeStation so program 81 stores and retrieves calculated values to and from a text file on the user’s hard drive using Streamwriter and Streamreader (the name and location of the file being defined by a user input–make sure that you use and appropriate location and name for this file).

Also see Program 80 which uses the Time and Sales provider
and Quick-tip 33 which demonstrates a method to enable the use of color object name in a plot statement
The Time and Sales provider, Streamwriter and Streamreader are created in a Once statement along with a Dictionary and a Tokenlist. An update event is created for the Time and Sales provider. The Streamreader reads the contents of the text file. If it contains any data from a previous use of the program it copies the values into the Dictionary.
For each historic bar the program compares the datetime for that bar to see if there is a corresponding entry in the dictionary (real time values are indexed by the BarDateTime value). If so, the values are copied into a TokenList (which accepts a comma separated list and puts the values in different elements). The historic values are then plotted.
For real time bars, when a time and sales update-event occurs one of three actions is taken:
- If the update is a trade, the TradeCount variable is incremented by 1
- If the update is an ask, the AskCount variable is incremented by 1
- If the update is a bid, the BidCount variable is incremented by 1
The counter values are written to a text file on the last tick of the bar using Streamwriter with the BarDateTime as an index on the last tick of each bar. On the last tick of the bar TradeCount, AskCount and BidCount are reset to zero for the following bar.
// The syntax used to write the data in the text file is as follows

If BarStatus( 1 ) = 2 and GetAppInfo( aiRealTimeCalc ) = 1 then
Begin
SWData.WriteLine( BarDateTime.Format( "%m/%d/%y %H:%M:%S" ) + ","
+ NumToStr( TradeCount, 0 ) + "," + NumToStr( BidCount, 0 ) + "," + NumToStr( AskCount, 0 ) );
End;
In addition the plots are analyzed over a user input number of bars (ExtremeNum). If the plot value for the current bar is greater than the plot values in the previous ExtremeNum bars its color is changed to another user input: ExtremeColor. This input is a string value that refers to a TradeStation color object. Available colors are listed at the bottom of this page.
Value1 = Plot1[5];
i.e. set Value1 to be equal to the value of Plot1 5 bars ago.
This type of functionality is used in this program to check whether the current plot value is greater than the same plot in a user defined number of bars before it.
When using this indicator, a different value of FileNameAndPath must be used for each instance of the program.
The program does not provide any functionality to ensure that the text file storing historic data is used with the same symbol and bar length with which it was created.
The program relies on indexing values based on the bar datetime. This will restrict its use with bars other than
intraday time based bars (e.g. tick bars).
Remember that data is only stored in the text file with the program was previously applied to real time data. In the image below the absence of data is apparant towards the left of the chart.
A study of this program should provide insights in the use and application of:
- Time and sales providers
- Streamwriter and Streamreader objects
- Copying data from a text file to a Dictionary
- Copying comma delimted information from a dictionary into a Tokenlist
- Using a color object name to SetPlotColor
- Monitoring plots for extreme values
Program 81 is available for immediate download for $39.95. The download is a TradeStation ELD file that includes the unprotected and commented program. This program will not work in MultiCharts because it uses the TradeStation collections and other functionality that is not available in the MultiCharts environment.
Video explanation
Please contact markplex.com if you find any bugs or have questions.
Available colors
| AliceBlue | DarkSlateGray | LightSalmon | PaleVioletRed |
| AntiqueWhite | DarkTurquoise | LightSeaGreen | PapayaWhip |
| Aqua | DarkViolet | LightSkyBlue | PeachPuff |
| Aquamarine | DeepPink | LightSlateGray | Peru |
| Azure | DeepSkyBlue | LightSteelBlue | Pink |
| Beige | DimGray | LightYellow | Plum |
| Bisque | DodgerBlue | Lime | PowderBlue |
| Black | Firebrick | LimeGreen | Purple |
| BlanchedAlmond | FloralWhite | Linen | Red |
| Blue | ForestGreen | Magenta | RosyBrown |
| BlueViolet | Fuschia | Maroon | RoyalBlue |
| Brown | Gainsboro | MediumAquamarine | SaddleBrown |
| Burlywood | GhostWhite | MediumBlue | Salmon |
| CadetBlue | Gold | MediumOrchid | SandyBrown |
| Chartreuse | Goldenrod | MediumPurple | SeaGreen |
| Chocolate | Gray | MediumSeaGreen | Seashell |
| Coral | Green | MediumSlateBlue | Sienna |
| CornflowerBlue | GreenYellow | MediumSpringGreen | Silver |
| Cornsilk | Honeydew | MediumTurquoise | SkyBlue |
| Cyan | HotPink | MediumVioletRed | SlateBlue |
| DarkBlue | IndianRed | MidnightBlue | SlateGray |
| DarkBrown | Indigo | MintCream | Snow |
| DarkCyan | Ivory | MistyRose | SpringGreen |
| DarkGoldenrod | Khaki | Moccasin | SteelBlue |
| DarkGray | Lavender | NavajoWhite | Tan |
| DarkGreen | LavenderBlush | Navy | Teal |
| DarkKhaki | LawnGreen | OldLace | Thistle |
| Dark Magenta | LemonChiffon | Olive | Tomato |
| DarkOliveGreen | LightBlue | OliveDrab | Turquoise |
| DarkOrange | LightCoral | Orange | Violet |
| DarkOrchid | LightCyan | OrangeRed | Wheat |
| DarkRed | LightGoldenrodYellow | Orchid | White |
| DarkSalmon | LightGray | PaleGoldenrod | WhiteSmoke |
| DarkSeaGreen | LightGreen | PaleGreen | Yellow |
| DarkSlateBlue | LightPink | PaleTurquoise | YellowGreen |
THESE INDICATORS, SHOW ME STUDIES, STRATEGIES AND OTHER PROGRAMS HAVE BEEN INCLUDED SOLELY FOR EDUCATIONAL PURPOSES.
TO THE BEST OF MARKPLEX CORPORATION’S KNOWLEDGE, ALL OF THE INFORMATION ON THIS PAGE IS CORRECT, AND IT IS PROVIDED IN THE HOPE THAT IT WILL BE USEFUL. HOWEVER, MARKPLEX CORPORATION ASSUMES NO LIABILITY FOR ANY DAMAGES, DIRECT OR OTHERWISE, RESULTING FROM THE USE OF THIS INFORMATION AND/OR PROGRAM(S) DESCRIBED, AND NO WARRANTY IS MADE REGARDING ITS ACCURACY OR COMPLETENESS. USE OF THIS INFORMATION AND/OR PROGRAMS DESCRIBED IS AT YOUR OWN RISK.
ANY EASYLANGUAGE OR POWERLANGUAGE TRADING STRATEGIES, SIGNALS, STUDIES, INDICATORS, SHOWME STUDIES, PAINTBAR STUDIES, PROBABILITYMAP STUDIES, ACTIVITYBAR STUDIES, FUNCTIONS (AND PARTS THEREOF) AND ASSOCIATED TECHNIQUES REFERRED TO, INCLUDED IN OR ATTACHED TO THIS TUTORIAL OR PROGRAM DESCRIPTION ARE EXAMPLES ONLY, AND HAVE BEEN INCLUDED SOLELY FOR EDUCATIONAL PURPOSES. MARKPLEX CORPORATION. DOES NOT RECOMMEND THAT YOU USE ANY SUCH TRADING STRATEGIES, SIGNALS, STUDIES, INDICATORS, SHOWME STUDIES, PAINTBAR STUDIES, PROBABILITYMAP STUDIES, ACTIVITYBAR STUDIES, FUNCTIONS (OR ANY PARTS THEREOF) OR TECHNIQUES. THE USE OF ANY SUCH TRADING STRATEGIES, SIGNALS, STUDIES, INDICATORS, SHOWME STUDIES, PAINTBAR STUDIES, PROBABILITYMAP STUDIES, ACTIVITYBAR STUDIES, FUNCTIONS AND TECHNIQUES DOES NOT GUARANTEE THAT YOU WILL MAKE PROFITS, INCREASE PROFITS, OR MINIMIZE LOSSES.