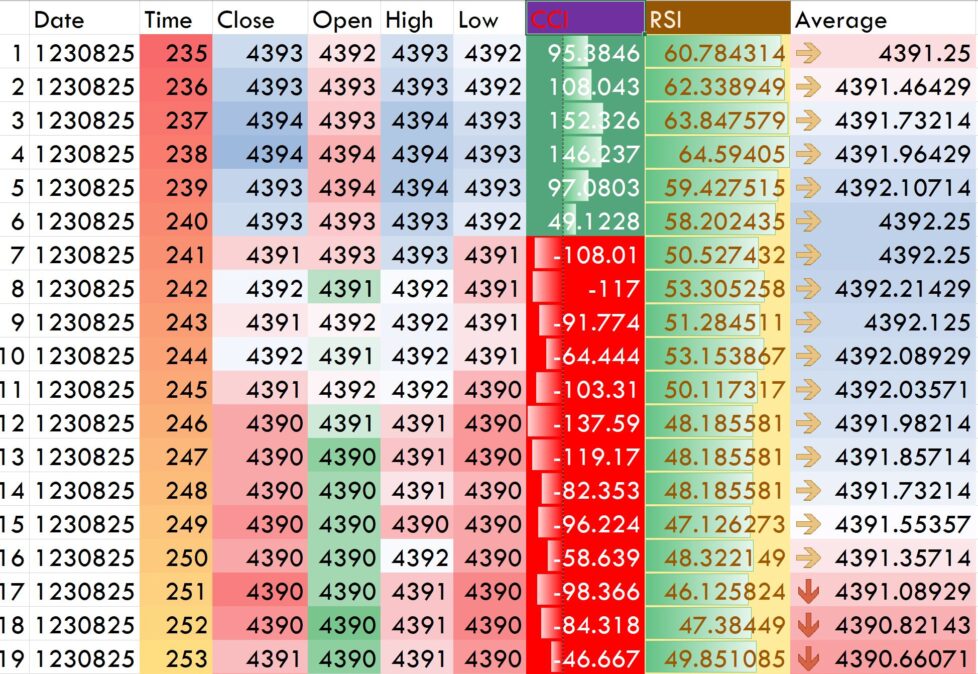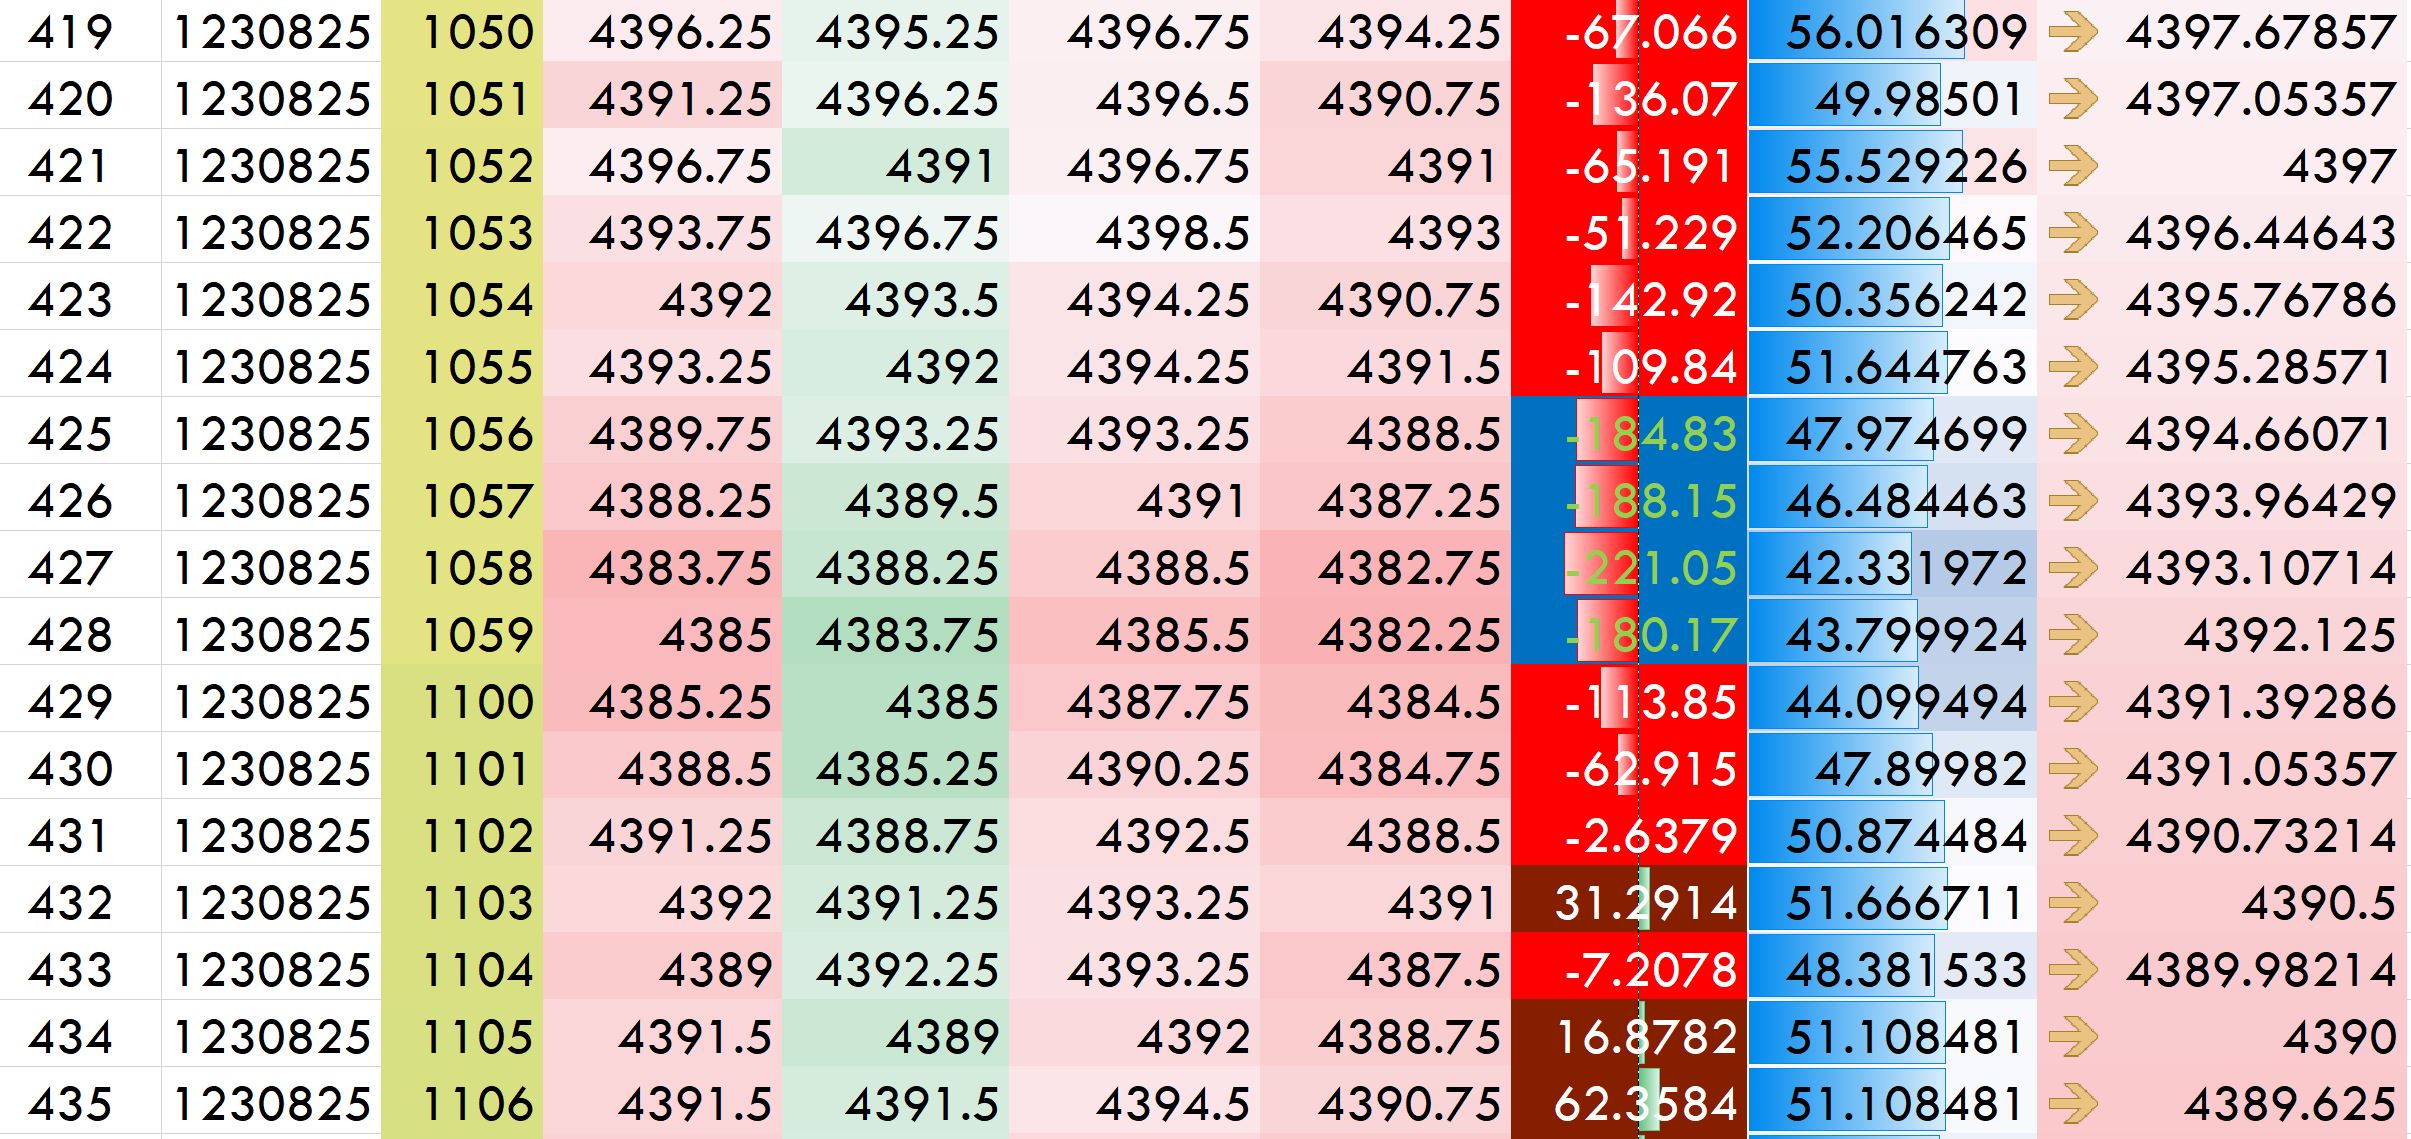
A Gold Pass member asked how I would go about capturing, for each bar on the chart, the bar data (open, high, low, close) and the results of several indicators applied to a chart. Tutorial 197 is a simple tutorial that demonstrates one way in which this can be done by storing the data in an Excel spreadsheet.
In tutorial 197 the following data is stored for each successive bar: a bar counter, date , time, close, open, high, low, the value of the calculated CCI, the values of the calculated RSI and the average of the closing price. The values for the most recent bar are updated in real time.
When the program is restarted it reopens and rewrites the data. The tutorial also touched upon the use of the Microsoft Excel “Conditional Formatting” feature (see below). This allows various formats to be applied in Excel that highlight information being displayed.
If you are interested in other aspects of EasyLanguage/Excel integration, please take a look at the tutorials here:
- Tutorial 150 | Sharing data between two charts using Microsoft Excel
- Tutorial 113 | Using data from an Excel sheet to update an EasyLanguage program
- Tutorial 112 | Transfer price data from a Price Series Provider applied to a chart to an Excel spreadsheet
- Tutorial 96 | Using the Workbook component to share information with Excel
Tutorial 197
Conditional formatting in Excel
Conditional formatting in Excel is a powerful feature that enables users to automatically apply formatting to cells based on specified conditions. This functionality goes beyond traditional manual formatting by allowing you to create rules that dynamically change the appearance of cells based on their contents or values.
With conditional formatting, you can highlight, color, bold, italicize, underline, and apply other formatting styles to cells. This helps you visually emphasize important data points, patterns, trends, or anomalies in your spreadsheet without the need to manually update the formatting as the data changes.
Some of the key capabilities of conditional formatting in Excel include:
Color Scales: Apply color gradients to cells to visualize data variations based on relative values. Higher or lower values can be indicated with different colors, making it easy to identify trends.
Icon Sets: Display specific icons (such as arrows, shapes, or symbols) in cells to represent data ranges or trends, adding a visual representation to your data.
Data Bars: Add horizontal bars to cells to show the magnitude of values relative to each other, helping to quickly gauge differences.
Top/Bottom Rules: Automatically highlight the highest or lowest values within a range, making it easier to spot outliers or extremes.
Text/Number/Date Filters: Format cells based on text content, numerical ranges, or date values, enabling you to emphasize data that meets specific criteria.
Formula-Based Rules: Create custom rules using formulas to format cells based on complex conditions involving multiple cell values.
Duplicate Values: Identify and format duplicate or unique values within a dataset.
Custom Formatting: Tailor formatting styles to your specific needs, including font, background color, border styles, and more.
Logical Operators: Utilize logical operators (such as AND, OR) to combine conditions and apply formatting based on compound rules.
Cell Value Changes: Detect changes in cell values and apply formatting when data is updated or modified.
Conditional formatting in Excel can enhance data analysis and visualization, making it easier to draw insights from large sets of information. This feature potentially empowers users to instantly spot patterns, discrepancies, and trends, leading to more informed decision-making and improved communication of data-driven findings.

The designer generated code
(created by TradeStation automatically when the initialize and uninitilialize events were created)
	{ This method gets called by EasyLanguage one time
	  at the beginning to create and initialize the components }

method override void InitializeComponent()
begin

		//---------------------------
		//analysistechnique
		//---------------------------

		//--------------------------------------------
		//                  Events
		//--------------------------------------------
		self.initialized += analysistechnique_initialized;
		self.uninitialized += analysistechnique_uninitialized;
end;
Program usage notes
1. If you get the “Error getting sheet, sheet not found” error, make sure that there is an Excel spreadsheet with a name and location as specified in your user inputs. You will need to manually create this spreadsheet when you first use the program. Also make sure that there is a sheet named “Sheet1” in the spreadsheet. After making the changes click CTRL-R.
2. When changing the data, for example, changing from a greater number of bars to a smaller number, clear the spreadsheet by click the top left square and the DEL key and then saving the spreadsheet.
3. After making ‘conditional formatting’ or other format changes, save the spreadsheet.
Free Gold Pass download of the tutorial 197 code
If you are a Gold Pass member you can download the tutorial 197 program for free. (Make sure that you are logged into Gold Pass): ![]() This content is for members only.
This content is for members only.
SPECIAL OFFER
This tutorial program is available as part of a bundle of tutorials that discuss Excel linkage. The other tutorials are 96, 112, 113 and 150. The regular price for the programs is $134.75. This bundle price is $69.95 (a 48% discount). Click the ‘add to cart’ button below.
You may pay using PayPal or a credit card.
Download tutorial 197 only
Hopefully you can understand this tutorial and replicate it. If you want to save some time typing in the code then the Tutorial 197 indicator is available for IMMEDIATE download for $9.95 by clicking the following ‘add to cart’ button. The tutorial is NOT compatible with MultiCharts. Click the ‘add to cart’ button below. You may pay using PayPal or a credit card.
TO THE BEST OF MARKPLEX CORPORATION’S KNOWLEDGE, ALL OF THE INFORMATION ON THIS PAGE IS CORRECT, AND IT IS PROVIDED IN THE HOPE THAT IT WILL BE USEFUL. HOWEVER, MARKPLEX CORPORATION ASSUMES NO LIABILITY FOR ANY DAMAGES, DIRECT OR OTHERWISE, RESULTING FROM THE USE OF THIS INFORMATION AND/OR PROGRAM(S) DESCRIBED, AND NO WARRANTY IS MADE REGARDING ITS ACCURACY OR COMPLETENESS. USE OF THIS INFORMATION AND/OR PROGRAMS DESCRIBED IS AT YOUR OWN RISK.
ANY EASYLANGUAGE OR POWERLANGUAGE TRADING STRATEGIES, SIGNALS, STUDIES, INDICATORS, SHOWME STUDIES, PAINTBAR STUDIES, PROBABILITYMAP STUDIES, ACTIVITYBAR STUDIES, FUNCTIONS (AND PARTS THEREOF) AND ASSOCIATED TECHNIQUES REFERRED TO, INCLUDED IN OR ATTACHED TO THIS TUTORIAL OR PROGRAM DESCRIPTION ARE EXAMPLES ONLY, AND HAVE BEEN INCLUDED SOLELY FOR EDUCATIONAL PURPOSES. MARKPLEX CORPORATION. DOES NOT RECOMMEND THAT YOU USE ANY SUCH TRADING STRATEGIES, SIGNALS, STUDIES, INDICATORS, SHOWME STUDIES, PAINTBAR STUDIES, PROBABILITYMAP STUDIES, ACTIVITYBAR STUDIES, FUNCTIONS (OR ANY PARTS THEREOF) OR TECHNIQUES. THE USE OF ANY SUCH TRADING STRATEGIES, SIGNALS, STUDIES, INDICATORS, SHOWME STUDIES, PAINTBAR STUDIES, PROBABILITYMAP STUDIES, ACTIVITYBAR STUDIES, FUNCTIONS AND TECHNIQUES DOES NOT GUARANTEE THAT YOU WILL MAKE PROFITS, INCREASE PROFITS, OR MINIMIZE LOSSES.

