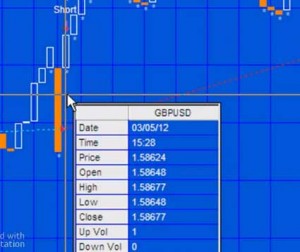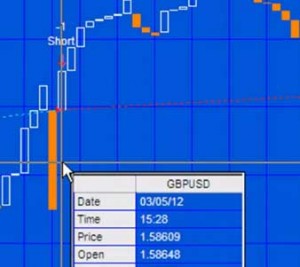
I am often asked to write strategies based on line break charts (e.g a three line break chart). I caution my clients that line break charts can be deceptive because they ‘hide’ price movement information. This can have its advantages in that it could give you a general sense of the direction of the market, however, as you will see in this tutorial, it can also be the reason why actual results are different from those seen in historical testing.
In this tutorial I use simple strategy (see the code below) to show how trades appear in real time (on a simulated account) compared with how they would have looked historically.
In the image on the right I have applied the simple program shown below and left it applied to the chart as bars form in real time. I also printed asterisks below the ‘real time’ bars so that it is easy to distinguish them from the historic bars. In the image you will see that there is a sell short trade well below the low of the 3 line break bar.

When I refreshed the chart (using CTRL-R) the trade appeared as in the next image. Notice that the short trade now appears at the low of the three line break bar rather than below it. I demonstrate this in the video below. Imagine how this difference could affect your strategies when applied to line break charts?
In program 5 I created a strategy that used the advantages of the line break concept, but applied it to regular candlestick charts. This strategy may give you some ideas as to how you could develop similar strategies utilizing the line break concept.
Video demonstration | Real time vs historical trades
Example code
UpBar( False ),
DownBar( False );
UpBar = C > O;
DownBar = O > C;
If UpBar[1] and DownBar then Sell Short next bar at C + .00020 Limit ;
If DownBar[1] and UpBar then Buy next bar at C – .00020 Limit ;
If LastBarOnChart then Value1 = Text_New( D, T, L, “*” );
Please email me at martyn.whittaker@markplex.com if you spot any bugs or errors.
More information
The following are links to the programs and tutorials I refer to above:
Tutorial 23 | A 3 line break (3LB) indicator for normal charts
Program 3 | Three line break show-me study
Program 5 | Line break strategy
You can download each of the (unprotected) programs individually at the above links or if you are also interested in program 3, program 5 and tutorial 23, a bundle of all three products (programs 3 and 5, together with tutorial 23) is available for $114.95. This is a 20% discount off the price of buying all three products separately. Click the following link to pay with PayPal or credit card:
As always, Gold Pass members are eligible for a 20% discount off this price. If you are a Gold Pass member you can get the current discount code here.
TO THE BEST OF MARKPLEX CORPORATION’S KNOWLEDGE, ALL OF THE INFORMATION ON THIS PAGE IS CORRECT, AND IT IS PROVIDED IN THE HOPE THAT IT WILL BE USEFUL. HOWEVER, MARKPLEX CORPORATION ASSUMES NO LIABILITY FOR ANY DAMAGES, DIRECT OR OTHERWISE, RESULTING FROM THE USE OF THIS INFORMATION AND/OR PROGRAM(S) DESCRIBED, AND NO WARRANTY IS MADE REGARDING ITS ACCURACY OR COMPLETENESS. USE OF THIS INFORMATION AND/OR PROGRAMS DESCRIBED IS AT YOUR OWN RISK.
ANY EASYLANGUAGE OR POWERLANGUAGE TRADING STRATEGIES, SIGNALS, STUDIES, INDICATORS, SHOWME STUDIES, PAINTBAR STUDIES, PROBABILITYMAP STUDIES, ACTIVITYBAR STUDIES, FUNCTIONS (AND PARTS THEREOF) AND ASSOCIATED TECHNIQUES REFERRED TO, INCLUDED IN OR ATTACHED TO THIS TUTORIAL OR PROGRAM DESCRIPTION ARE EXAMPLES ONLY, AND HAVE BEEN INCLUDED SOLELY FOR EDUCATIONAL PURPOSES. MARKPLEX CORPORATION. DOES NOT RECOMMEND THAT YOU USE ANY SUCH TRADING STRATEGIES, SIGNALS, STUDIES, INDICATORS, SHOWME STUDIES, PAINTBAR STUDIES, PROBABILITYMAP STUDIES, ACTIVITYBAR STUDIES, FUNCTIONS (OR ANY PARTS THEREOF) OR TECHNIQUES. THE USE OF ANY SUCH TRADING STRATEGIES, SIGNALS, STUDIES, INDICATORS, SHOWME STUDIES, PAINTBAR STUDIES, PROBABILITYMAP STUDIES, ACTIVITYBAR STUDIES, FUNCTIONS AND TECHNIQUES DOES NOT GUARANTEE THAT YOU WILL MAKE PROFITS, INCREASE PROFITS, OR MINIMIZE LOSSES.

