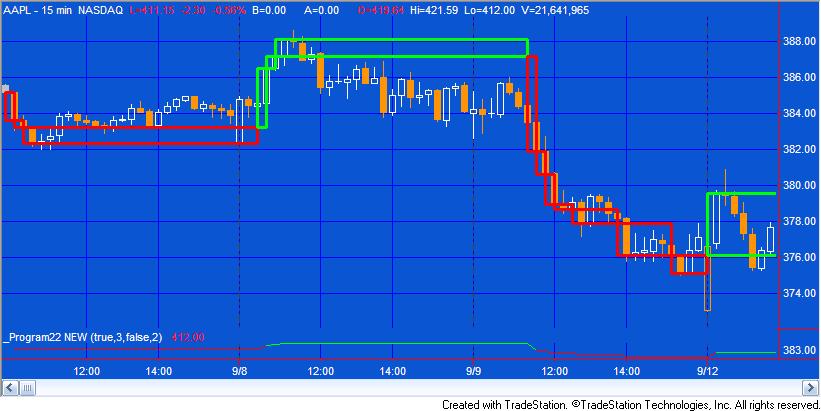
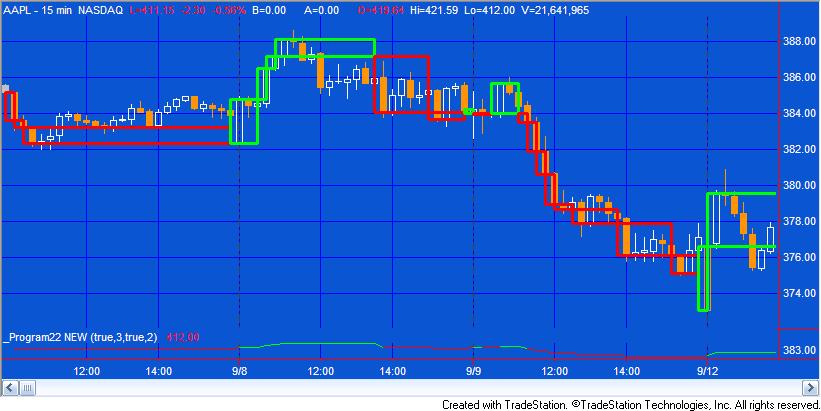
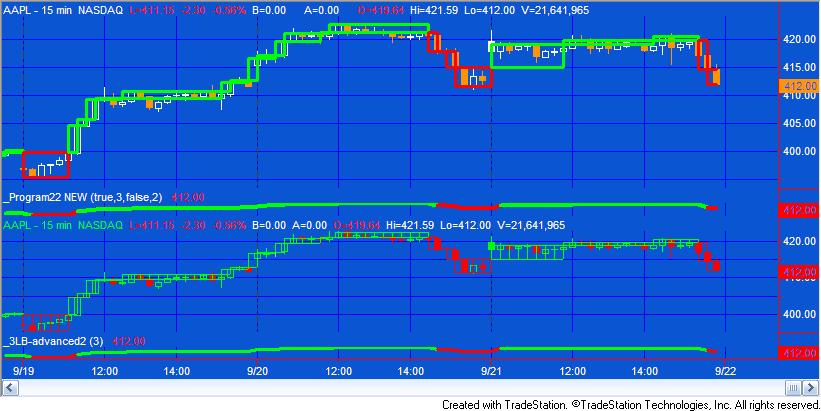
In tutorial 23 I created an indicator that superimposed three line break lines over a regular chart. I developed this program further in program 3 (a three line break show me study), program 4 (a three line break pivot confluence program) and program 5 (a strategy based on the three line break principle). Program 22 | Configurable Three Line Break Indicator, adds to tutorial 23 by the introduction of an input which, if set to TRUE, resets the line break every day. I explain more in the video below. I have also added the following additional capabilities:
- An input which when set to true, turns off the ‘lines’ or boxes.
- An input to control the thickness of the lines (or boxes).
- An input to determine how many lines to include in the ‘break.’ The default being three (this one was already included in tutorial 23)
In addition, the ‘lines’ are represented by rectangles, as opposed to the segmented rectangles that were used in the earlier program.
The program is a TradeStation EasyLanguage Indicator developed in TradeStation 9.0. The unprotected source code is included with the download which included both the indicator and a function which draws the upper and lower lines of the boxes.
To download the program for a nominal fee click here:

I explain the functionality in more detail in the video, lower down the page.


To download the program for a nominal fee click here:
This TradeStation EasyLanguage indicator is demonstrated here:
Video demonstration of program 22
Inputs
Program 22 has four input settings as follows:
- LinesOn( TRUE ), // Determines whether the lines or ‘boxes’ are drawn
- NumBarsBreak( 3 ), // How many line breaks we are loking for
- DailyReset( True ), // Restart the line break functionality every day
- Thickness( 4 ); // Thickness of the trendline, 0 – 6.
To download the program for a nominal fee click here:
The program may be applied to intraday, daily weekly, and monthly charts.
.
TO THE BEST OF MARKPLEX CORPORATION’S KNOWLEDGE, ALL OF THE INFORMATION ON THIS PAGE IS CORRECT, AND IT IS PROVIDED IN THE HOPE THAT IT WILL BE USEFUL. HOWEVER, MARKPLEX CORPORATION ASSUMES NO LIABILITY FOR ANY DAMAGES, DIRECT OR OTHERWISE, RESULTING FROM THE USE OF THIS INFORMATION AND/OR PROGRAM(S) DESCRIBED, AND NO WARRANTY IS MADE REGARDING ITS ACCURACY OR COMPLETENESS. USE OF THIS INFORMATION AND/OR PROGRAMS DESCRIBED IS AT YOUR OWN RISK.
ANY EASYLANGUAGE OR POWERLANGUAGE TRADING STRATEGIES, SIGNALS, STUDIES, INDICATORS, SHOWME STUDIES, PAINTBAR STUDIES, PROBABILITYMAP STUDIES, ACTIVITYBAR STUDIES, FUNCTIONS (AND PARTS THEREOF) AND ASSOCIATED TECHNIQUES REFERRED TO, INCLUDED IN OR ATTACHED TO THIS TUTORIAL OR PROGRAM DESCRIPTION ARE EXAMPLES ONLY, AND HAVE BEEN INCLUDED SOLELY FOR EDUCATIONAL PURPOSES. MARKPLEX CORPORATION. DOES NOT RECOMMEND THAT YOU USE ANY SUCH TRADING STRATEGIES, SIGNALS, STUDIES, INDICATORS, SHOWME STUDIES, PAINTBAR STUDIES, PROBABILITYMAP STUDIES, ACTIVITYBAR STUDIES, FUNCTIONS (OR ANY PARTS THEREOF) OR TECHNIQUES. THE USE OF ANY SUCH TRADING STRATEGIES, SIGNALS, STUDIES, INDICATORS, SHOWME STUDIES, PAINTBAR STUDIES, PROBABILITYMAP STUDIES, ACTIVITYBAR STUDIES, FUNCTIONS AND TECHNIQUES DOES NOT GUARANTEE THAT YOU WILL MAKE PROFITS, INCREASE PROFITS, OR MINIMIZE LOSSES.

