
Background to the Bollinger Squeeze function
Back in program 59 and tutorial 98 I developed programs that calculated the distance between the upper and lower Bollinger bands. This was then compared with the same distance for a number of bars. If it was the least the programs recognized it as a ‘squeeze’.

A Markplex visitor suggest that I create a strategy based around this concept. Because the Bollinger squeeze is not a signal by itself, I have created Program 73, a function that calculates the Bollinger squeeze and returns an integer value of the number of bars after the last squeeze occurred. A narrowing of Bollinger bands is an indication of lower volatility. According to John Bollinger, creator of the Bollinger band concept, periods of low volatility are often followed by periods of high volatility. This could mean that a narrowing of the Bollinger bands (or a period of lower volatility) –a ‘squeeze’–may foreshadow a period of higher volatility, or a breakout in price. Consequently the function could be potentially used in a strategy as one of the entry conditions.
Program 73 is available for download together with and example strategy that calls the function.
_Program73( Price series to be used in the Bollinger Band Calculation,
The Bollinger length in the Bollinger calculation,
Number of standard deviations up,
Number of standard deviations down,
the number of bars examined to see if the difference between the upper and lower Bollinger bands is the lowest )
for example, Value1 = _Program73( C, 20, 2, -2, 120 );
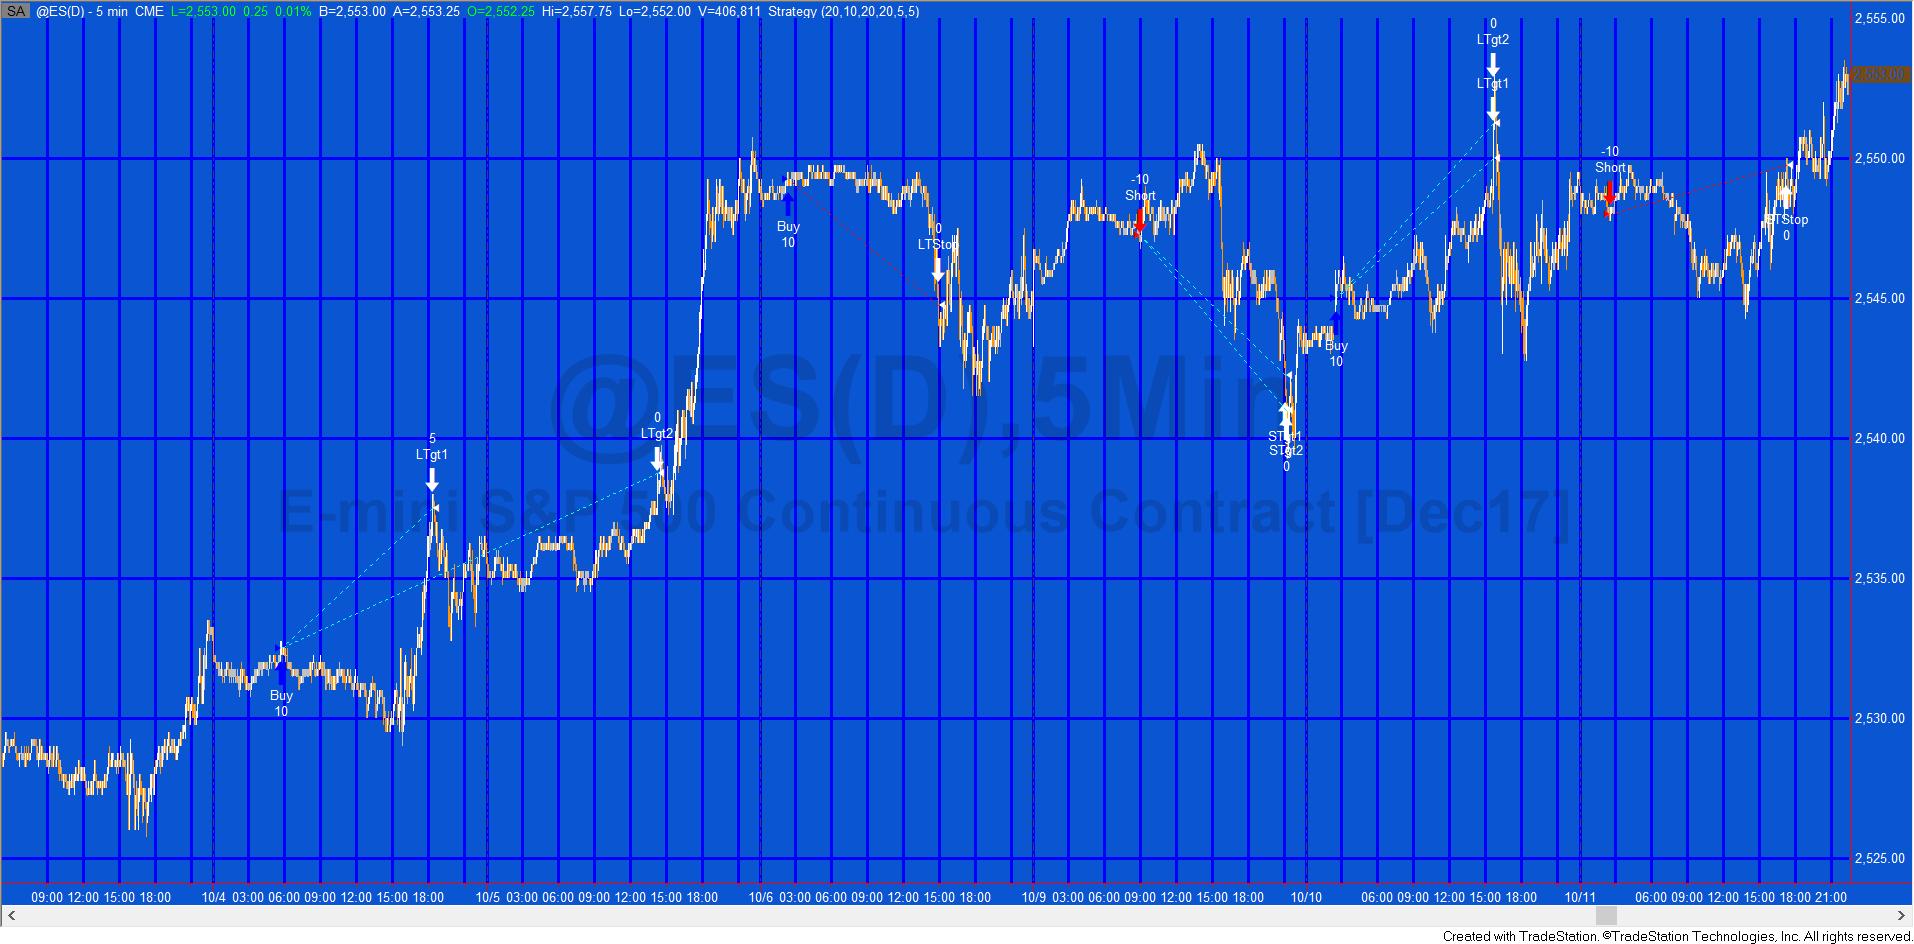
Program 73 companion strategy
The companion strategy is a breakout strategy that includes various trade management features.
Trade management uses the following inputs:
- Cts (the total number of contracts or shares traded),
- TrailVal (Trail value expressed as a multiple of ticks),
- Tgt1 (Target 1 from entry price expressed as a multiple of ticks.
- FirstTgtCts contracts or shares are exited here),
- Tgt2 (Target 2 from entry price expressed as a multiple of ticks. The remainder of contracts or shares are exited here),
- FirstTgtCts (The number of contracts or shares to exit at the first target).
Bollinger squeeze function video
Program 73 download
Both the program 73 function and strategy are available for immediate download for $34.95. They will work with TradeStation and Multicharts.
This function and the strategy are available for immediate download for $34.95 by clicking the ‘add to cart’ button below. You may pay using PayPal or a credit card.
Programming notes
- Creating a simple function
- Finding the low of a series of values (in this case, the difference between the high and low Bollinger bands)
- Basic trade management including trailing stop, stop, and targets
- Creating filters
- Incrementing a counter
Please note that any screen shots on this site are examples and are not meant to imply that any of these programs will generate profitable trades. THESE INDICATORS, SHOW ME STUDIES, STRATEGIES AND OTHER PROGRAMS HAVE BEEN INCLUDED SOLELY FOR EDUCATIONAL PURPOSES.
TO THE BEST OF MARKPLEX CORPORATION’S KNOWLEDGE, ALL OF THE INFORMATION ON THIS PAGE IS CORRECT, AND IT IS PROVIDED IN THE HOPE THAT IT WILL BE USEFUL. HOWEVER, MARKPLEX CORPORATION ASSUMES NO LIABILITY FOR ANY DAMAGES, DIRECT OR OTHERWISE, RESULTING FROM THE USE OF THIS INFORMATION AND/OR PROGRAM(S) DESCRIBED, AND NO WARRANTY IS MADE REGARDING ITS ACCURACY OR COMPLETENESS. USE OF THIS INFORMATION AND/OR PROGRAMS DESCRIBED IS AT YOUR OWN RISK.
ANY EASYLANGUAGE OR POWERLANGUAGE TRADING STRATEGIES, SIGNALS, STUDIES, INDICATORS, SHOWME STUDIES, PAINTBAR STUDIES, PROBABILITYMAP STUDIES, ACTIVITYBAR STUDIES, FUNCTIONS (AND PARTS THEREOF) AND ASSOCIATED TECHNIQUES REFERRED TO, INCLUDED IN OR ATTACHED TO THIS TUTORIAL OR PROGRAM DESCRIPTION ARE EXAMPLES ONLY, AND HAVE BEEN INCLUDED SOLELY FOR EDUCATIONAL PURPOSES. MARKPLEX CORPORATION. DOES NOT RECOMMEND THAT YOU USE ANY SUCH TRADING STRATEGIES, SIGNALS, STUDIES, INDICATORS, SHOWME STUDIES, PAINTBAR STUDIES, PROBABILITYMAP STUDIES, ACTIVITYBAR STUDIES, FUNCTIONS (OR ANY PARTS THEREOF) OR TECHNIQUES. THE USE OF ANY SUCH TRADING STRATEGIES, SIGNALS, STUDIES, INDICATORS, SHOWME STUDIES, PAINTBAR STUDIES, PROBABILITYMAP STUDIES, ACTIVITYBAR STUDIES, FUNCTIONS AND TECHNIQUES DOES NOT GUARANTEE THAT YOU WILL MAKE PROFITS, INCREASE PROFITS, OR MINIMIZE LOSSES.