
 Program 80 uses a Time and Sales provider to analyze trade information.
The objective of program 80 is to highlight situations where trades of more than average size have occured within a bar.
It uses two different ways of analysing the situation to do this. I have called them ‘five percent volume ratio’ and ‘largest trade size.’ An explanation of how they are calculated is included below.
Since in TradeStation Time and Sales data is not available historically, program 80 stores and retrieves calculated values using Streamwriter and Streamreader writing to and reading from a text file on the user’s hard drive (the name and location of the file being defined by a user input.This means that once data has been processed and a calculation has been made, the result for those bars will be available the next time the program is opened on a specific chart.
You may also be interested in Tutorial 145 | Using Streamwriter & Streamreader to store and read bid/ask data and Tutorial 143 | Trade size analysis which cover similar subject areas.
Program 80 is available for immediate download for $69.95. The download is a TradeStation ELD file that includes the unprotected and commented program. This program will not work in MultiCharts because it uses the TradeStation collections and other functionality that is not available in the MultiCharts environment.
Overview of how program 80 works
The Time and Sales provider, Streamwriter and Streamreader are created in a Once statement along with vectors, a dictionary and a Tokenlist. An update event is created for the Time and Sales provider. The Streamreader reads the contents of the text file (if it contains any data from a previous use of the program) and copies the values into the Dictionary.
For historic bars the program compares the bar datetime of the bar being processed to see if there is a corresponding entry in the dictionary (real time values are indexed by the bardatetime value). If so, the values are copied into a TokenList (which accepts a comma separated list and puts the values in different elements). The historic values are then plotted.
For real time bars after the first full bar is processed, when a time and sales update-event occurs one of three actions is taken:
- If the update is NOT a trade, and the update is a bid, the bid price is stored in a variable (LastBidPrice).
- If the update is NOT a trade, and the update is an ask, the ask price is stored in a variable (LastAskPrice).
- If the update IS a trade, the size of the trade (number of contracts or shares) is stored in a vector (TradeVect).
In addition, if the price of the trade is equal to or less than the last recorded bid price it is stored in a vector called BidTradeVect. If the price of the trade is greater or equal to the last ask price it is stored in a vector named AskTradeVect.
The values are stored in the vectors using a method in the program named Record. The Record method makes sure that the values are stored in the respective vectors by order of size. In other words, the vectors are continually maintained in size order.
On the closing tick of each bar two calculations are made:
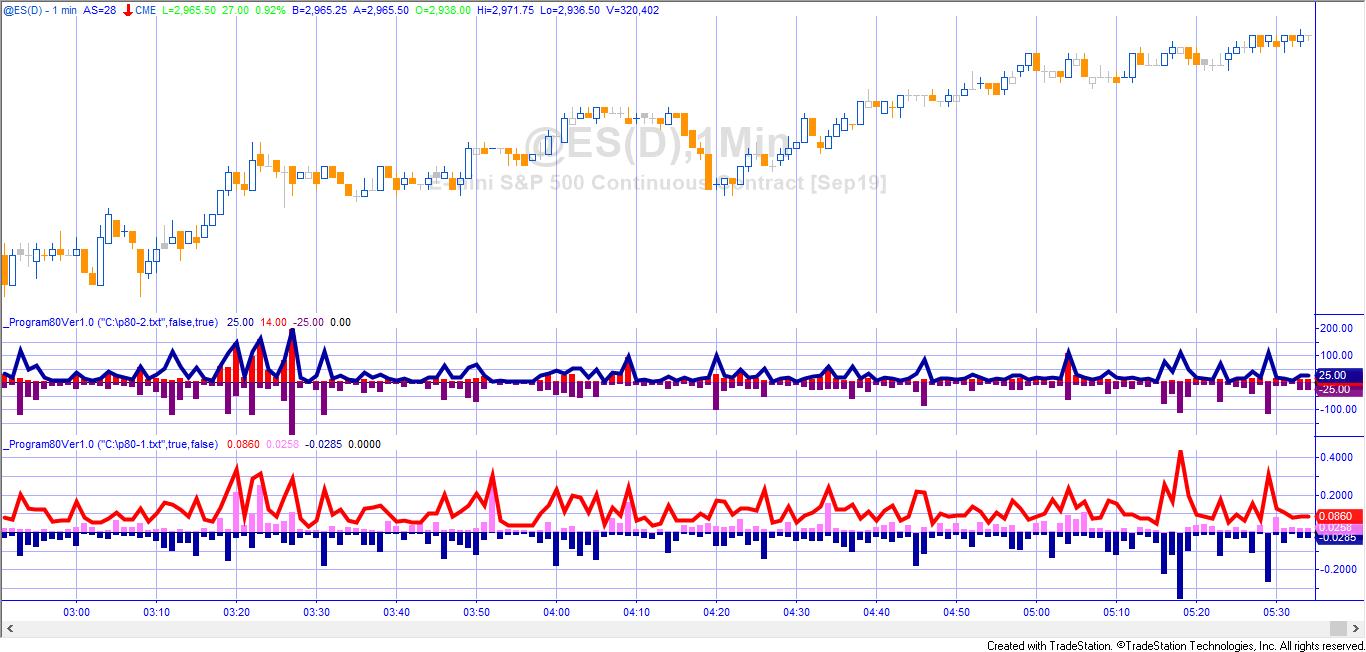
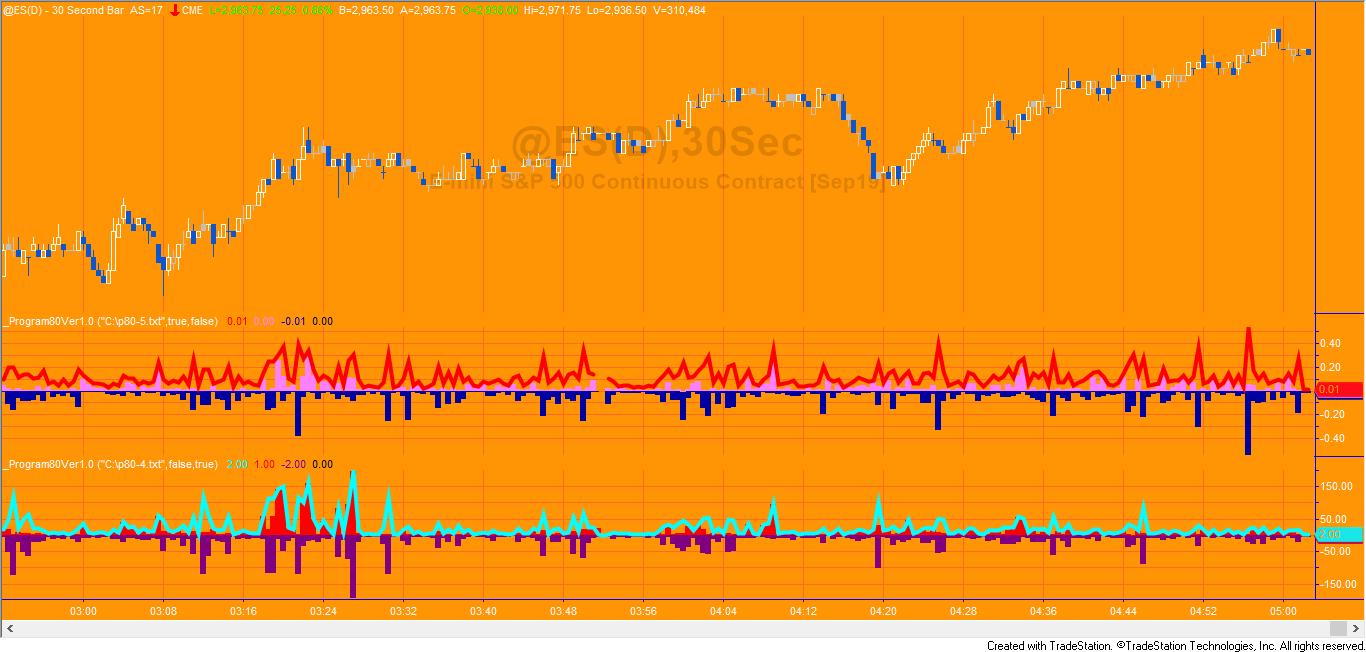
FIVE PERCENT VOLUME RATIO CALCULATION
An analysis of the vectors is made of the the top five percent of trades ordered by size divided by the total volume for a bar. This is calculated for:
- all trades,
- trades at ask price, and
- trades at bid price.
The calculation is done using a method called AnalyzeVector. A plot is made of these values. The negative value of the trades at ask price ratio is plotted
LARGEST TRADE SIZE CALCULATION
Since all the trades are already sorted in the vector by size, it is a trivial matter to find the largest trade size by retrieving the value stored in the zero position of the respective vectors. This is done using the AnalyzeVector method. The values are plotted. The negative value of the largest trade ask price is plotted.
The results or both the five percent volume ratio and the largest trade size calculations are written to a text file using Streamwriter with the BarDateTime as an index.
// The syntax used to write the data in the text file is as follows

SWData.WriteLine( BarDateTime.Format( "%m/%d/%y %H:%M:%S" ) + "," + NumToStr( FVolRatio, 2 ) + "," + NumToStr( BidFVolRatio, 2 ) + "," + NumToStr( AskFVolRatio, 2 ) + "," + NumToStr( HNumContracts, 0 ) + "," + NumToStr( BidHNumContracts, 0 ) + "," + NumToStr( AskHNumContracts, 0 ) );
- When using this indicator, a different value of FileNameAndPath must be used for each instance of the programs.
- When the program is first applied to a chart it will generate an error if the file name is already being used on another chart.
- Various commented-out print statements are included in the program source code. These were used for debugging purposes and are not required to run the program.
- The program relies on indexing values based on the bar datetime. This will restrict its use with bars other than intraday time based bars.
Video explanation
TECHNICAL CONSTRUCTS USED IN THE PROGRAM
A study of this program should provide insights in the use and application of:
- Time and sales providers
- Streamwriter and Streamreader objects
- Vectors
- Storing values in vectors in size order
- Copying data from a text file to a Dictionary
- Copying comma delimited information from a dictionary into a Tokenlist
Please contact markplex.com if you find any bugs or have questions.
THESE INDICATORS, SHOW ME STUDIES, STRATEGIES AND OTHER PROGRAMS HAVE BEEN INCLUDED SOLELY FOR EDUCATIONAL PURPOSES.
TO THE BEST OF MARKPLEX CORPORATION’S KNOWLEDGE, ALL OF THE INFORMATION ON THIS PAGE IS CORRECT, AND IT IS PROVIDED IN THE HOPE THAT IT WILL BE USEFUL. HOWEVER, MARKPLEX CORPORATION ASSUMES NO LIABILITY FOR ANY DAMAGES, DIRECT OR OTHERWISE, RESULTING FROM THE USE OF THIS INFORMATION AND/OR PROGRAM(S) DESCRIBED, AND NO WARRANTY IS MADE REGARDING ITS ACCURACY OR COMPLETENESS. USE OF THIS INFORMATION AND/OR PROGRAMS DESCRIBED IS AT YOUR OWN RISK.
ANY EASYLANGUAGE OR POWERLANGUAGE TRADING STRATEGIES, SIGNALS, STUDIES, INDICATORS, SHOWME STUDIES, PAINTBAR STUDIES, PROBABILITYMAP STUDIES, ACTIVITYBAR STUDIES, FUNCTIONS (AND PARTS THEREOF) AND ASSOCIATED TECHNIQUES REFERRED TO, INCLUDED IN OR ATTACHED TO THIS TUTORIAL OR PROGRAM DESCRIPTION ARE EXAMPLES ONLY, AND HAVE BEEN INCLUDED SOLELY FOR EDUCATIONAL PURPOSES. MARKPLEX CORPORATION. DOES NOT RECOMMEND THAT YOU USE ANY SUCH TRADING STRATEGIES, SIGNALS, STUDIES, INDICATORS, SHOWME STUDIES, PAINTBAR STUDIES, PROBABILITYMAP STUDIES, ACTIVITYBAR STUDIES, FUNCTIONS (OR ANY PARTS THEREOF) OR TECHNIQUES. THE USE OF ANY SUCH TRADING STRATEGIES, SIGNALS, STUDIES, INDICATORS, SHOWME STUDIES, PAINTBAR STUDIES, PROBABILITYMAP STUDIES, ACTIVITYBAR STUDIES, FUNCTIONS AND TECHNIQUES DOES NOT GUARANTEE THAT YOU WILL MAKE PROFITS, INCREASE PROFITS, OR MINIMIZE LOSSES.