
Strategy programs
A list of strategies and strategy related programs from markplex.com. To find out more about the strategy click on its name. To purchase the strategy click ‘add to cart.’
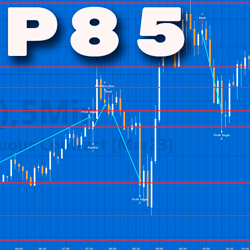
Program 85
Price: $74.95

Program 46 is designed to allow you to add text markers to a chart based on your own rules in order to generate dummy historical trades. The program could be used in conjunction with an indicator or showme study to test rules before building them into a strategy. For example, you could insert two moving averages and a stochastic indicator to the chart. If the averages crossed and stochastics were above or below a certain amount you could draw a ‘b’ for buy or ‘ss’ for sell short depending on your rules. Having gone through the entire chart and annotated it with text representing your trades and refreshed the screen, you could then view the strategy performance reports.
Price: $59.95

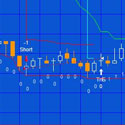
Program 54 is designed to look for a hammer candlestick pattern in a downtrend (to initiate short trades) and inverse hammer patterns in an uptrend (to initiate long trades).
Price: $129.95
Program 54 is designed to look for a hammer candlestick pattern in a downtrend (to initiate short trades) and inverse hammer patterns in an uptrend (to initiate long trades).
Price: $129.95
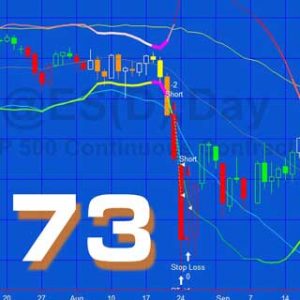
Program 59 and tutorial 98 calculate the distance between the upper and lower Bollinger bands. This was then compared with the same distance for a number of bars. If it was the least the programs recognized it as a ‘squeeze’. Program 73 is a strategy based around this concept. Because the Bollinger squeeze is not a signal by itself, I have created Program 73, a function that calculates the Bollinger squeeze and returns an integer value of the number of bars after the last squeeze occurred. A narrowing of Bollinger bands is an indication of lower volatility. According to John Bollinger, creator of the Bollinger band concept, periods of low volatility are often followed by periods of high volatility. This could mean that a narrowing of the Bollinger bands (or a period of lower volatility) –a ‘squeeze’–may foreshadow a period of higher volatility, or a breakout in price. Consequently the function could be potentially used in a strategy as one of the entry conditions.
Price: $34.95
Program 54 is designed to look for a hammer candlestick pattern in a downtrend (to initiate short trades) and inverse hammer patterns in an uptrend (to initiate long trades).
Price: $129.95
Program 54 is designed to look for a hammer candlestick pattern in a downtrend (to initiate short trades) and inverse hammer patterns in an uptrend (to initiate long trades).
Price: $129.95

Program 20 consists of an unprotected TradeStation EasyLanguage strategy that generates trades based on the crossing of CCI 'trend' lines. Trend lines are calculated by joining CCI pivot points and then continuing the imaginary line until crossed by the CCI. In addition long trades are only instigated when the CCI is below a value specified in the user input CCILowFilter and short trades are only instigated when the CCI value is greater than a value specified in the user input CCIHighFilter. The program also includes some filters that can be easily modified by the user.
Price: $165.00
Program 47 (Multicharts version)
Some view ghost patterns as a sign of a potential reversal. Program 47 (based on program 44) is designed to look for ‘ghost’ patterns in the Commodity Channel Index (CCI) and make trades based on either:
A confirmed ghost or inverted ghost pattern
A break of the ‘trend line’ drawn across the ‘shoulders’ of the ghost or inverted ghost pattern
Price: $94.95
Some view ghost patterns as a sign of a potential reversal. Program 47 (based on program 44) is designed to look for ‘ghost’ patterns in the Commodity Channel Index (CCI) and make trades based on either:
- A confirmed ghost or inverted ghost pattern
- A break of the ‘trend line’ drawn across the ‘shoulders’ of the ghost or inverted ghost pattern
Price: $94.95
Program 46 is designed to allow you to add text markers to a chart based on your own rules in order to generate dummy historical trades. The program could be used in conjunction with an indicator or showme study to test rules before building them into a strategy. For example, you could insert two moving averages and a stochastic indicator to the chart. If the averages crossed and stochastics were above or below a certain amount you could draw a ‘b’ for buy or ‘ss’ for sell short depending on your rules. Having gone through the entire chart and annotated it with text representing your trades and refreshed the screen, you could then view the strategy performance reports.
Price: $59.95

Program 18 consists of an unprotected strategy together with a protected EasyLanguage function and a smoothed CCI indicator. The function calculates the smoothed Markplex CCI (using the calculation previously applied in programs 10 and 11) and it is called from both the strategy and the indicator. The strategy bases signals on divergence between the smoothed CCI and price. The download includes MultiCharts export files. As with the TradeStation version, the CCI function is protected. The download includes the following files: PROGRAM18.ELD, _Program18.pla and_Program18-function.sef. If you are a TradeStation user will just need to install PROGRAM18.ELD. If you are a MultiCharts user you will need to install _Program18.pla and_Program18-function.sef. Install _Program18-function.sef BEFORE _Program18.pla.
Price: $225.00
Program 20 consists of an unprotected TradeStation EasyLanguage strategy that generates trades based on the crossing of CCI ‘trend’ lines. Trend lines are calculated by joining CCI pivot points and then continuing the imaginary line until crossed by the CCI. In addition long trades are only instigated when the CCI is below a value specified in the user input CCILowFilter and short trades are only instigated when the CCI value is greater than a value specified in the user input CCIHighFilter as well as user defined filters evaluating to TRUE.
Price: $195.00

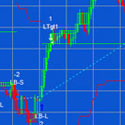
Program 13 is a strategy that looks for a pivot formation followed by a retracement before placing a limit order at the pivot price level. The strategy also allows the user to setup filters in order to easily customize the program. In the 'short' setup we look for a high pivot, for the price to dip down, then rise above the pivot level for a limit order to be placed next bar (you can also define filters to further restrict when a trade is placed.) The long setup requires a low pivot, followed by a lower low for a long limit order to be placed next bar (again, you can define filters to further restrict when trades are placed).
Price: $79.95

Program 12 is a TradeStation EasyLanguage strategy that searches for candlestick patterns (the specific candlestick patterns searched for depend on which user inputs are selected. If a pattern occurs and a user defined filter or user defined filters evaluate to true within a user defined number of bars, then a trade is instigated.
Price: $79.95

This strategy uses the pivot combining methodology described in tutorial 13 such that if a new pivot is discovered that combines with a previous level, and if that level has been combined over or equal to a user input number of times, then the strategy flags a potential trade.
Commentary in program 6A further condition for entry depends on the number of combined pivots above and below the last pivot found. The program counts the number of combined pivots above the pivot that exceed a user specific weighting (specified by the line sensitivity user input - see below) and those below that exceed a specified weighting.
For a potential long trade the number of pivots below the pivot that exceed a user specified weighting must be greater than those above (that exceed a user specified weighting).
For a short trade the number of pivot lines above the pivot that exceed a user specified weighting must be greater than those below that exceed user specified weighting. The program then evaluates additional user created filters to determine whether to enter a trade. (The above explanation assumes that DirVector is set to zero)
Price: $119.95
Program 5 takes the principles used in tutorial 23 and program 3 and builds them into a strategy. Instead of drawing a dot on the chart, as the ShowMe study does, the strategy issues a market order on the next bar after a new line break 'line' begins. The strategy includes several 'template' filters so that you can easily build filters into the program.
Price: $94.95
Tutorial strategy programs
The following tutorials also include programs that are available for download:
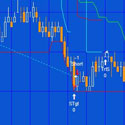
This tutorial demonstrates how to create a simple breakout strategy together with a target, stop and trailing stop. The target and the stop are based on a multiple of the average true range (ATR). The tutorial also shows a way of drawing the various levels on the chart to help you visualize what is happening. The continuous red and green lines delineate the channel. The stops are shown as red and green lines. The trailing stops have not yet been added in this image. Since the ATR value varies, so does the target value. With the stop I demonstrate how to ensure that the stop gets ‘tighter’ even if the ATR increases in value. The trailing stop is based a multiple of the minimum move of the instrument on the chart. The trailing stop functionality looks for price to move a certain distance from the entry price before starting to trail by a user defined amount.
Price: $39.95

Tutorial 125 demonstrates two ways to find out the fill prices for strategy orders.
This might be useful, for example, in a situation where a future entry or target price is determined by the exit price of another trade.
Price: $19.95
Tutorial 74 takes the program created in tutorial 71 and explains how, if two sequential losing trades occur, to introduces a pause for a specified number of minutes when the strategy does not take any new trades.
The original strategy, created in tutorial 71, is a simple breakout strategy together with a target, stop and trailing stop. The target and the stop are based on a multiple of the average true range (ATR).
Price: $44.95
This tutorial demonstrates how to create a simple breakout strategy together with a target, stop and trailing stop. The target and the stop are based on a multiple of the average true range (ATR). The tutorial also shows a way of drawing the various levels on the chart to help you visualize what is happening. The continuous red and green lines delineate the channel. The stops are shown as red and green lines. The trailing stops have not yet been added in this image. Since the ATR value varies, so does the target value. With the stop I demonstrate how to ensure that the stop gets ‘tighter’ even if the ATR increases in value. The trailing stop is based a multiple of the minimum move of the instrument on the chart. The trailing stop functionality looks for price to move a certain distance from the entry price before starting to trail by a user defined amount.
Price: $39.95
This step-by-step tutorial will guide you through several techniques including: using EasyLanguage’s built in candlestick pattern functions, drawing a character(s) on the chart when a candlestick pattern has occurred, using EasyLanguage StopLoss and ProfitTarget functions, finding stochastic crossovers and looking for confirmation signals a user-defined number of bars after an initial ‘warning signal.’
Price: $49.95
This tutorial uses as an example a CCI (Commodity Channel Index) cross of the zero line, followed by the crossing of two moving averages within a user input number of bars. In other words, once the CCI cross above the zero line occurs, we start counting. If the fast moving average crosses over the slow moving average within a specified number of bars we issue a buy order. If the CCI crosses below the zero line, we start counting. If the fast moving average crosses below the slow moving average within a specified number of bars we issue a sell short order.
Price: $19.95

Tutorial 66 works as follows: once the CCI crosses above the zero line occurs, the program starts counting. If the fast moving average crosses over the slow moving average within a specified number of bars and the ADX is greater than a user specified value then we issue a buy order. For going short, if the CCI crosses below the zero line, we start counting. If the fast moving average crosses below the slow moving average within a specified number of bars and the ADX is above a user input value, we issue a sell short order.
Price: $24.95