
![]() The following programs and tutorials from markplex.com are Multicharts compatible.
The following programs and tutorials from markplex.com are Multicharts compatible.
To find out more about the program click on its name. To purchase the program click ‘add to cart.’
Some of the programs are available as ELD files, while others are available as .PLA files.
Program 3 takes the core of the program code created in tutorial 23 and applies it to a show me study. The functionality to draw the 'quasi' 3 line break boxes/lines has been removed from the tutorial 23 program and showme dots are drawn at the start of, what would have been the green boxes/lines and what would have been the red boxes/lines on the tutorial 23 indicator.
Price: $19.95
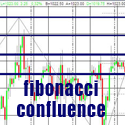
This Fibonacci-Confluence show-me study works by drawing percentage based zig zag lines and each time a new zig zag line is confirmed, Fibonacci levels are calculated. An array is created which stores Fibonacci levels. If a new Fibonacci level is found to be within a certain tolerance of an existing Fibonacci level stored in the array, it is 'merged' with the existing line. This is done by increasing the thickness parameter of the line. Lines are extended to the right if their thickness parameter is greater than an input value. The maximum thickness of a line plotted is TradeStation line thickness 4.
Price: $74.95
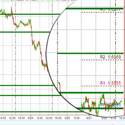
Program 2 calculates pivot levels (using the classic method of calculation, the 'Woodie' levels, or the 'Camarilla' levels). It then seeks to find pivot levels that are close to those found previously on the chart (within a specified user input tolerance) and draws these levels on the chart.
The rationale behind the program is that if pivot levels have had real significance on a previous day then some of that influence could still be felt on the current day.
Price: $49.95
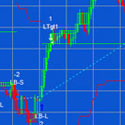
The program looks for turning points as they occur on a line break chart. Each newly discovered level is compared with levels already stored in an array. If the new level is close enough to an existing level, the two levels are combined. The number of times that each line is combined is also stored in the array. If the new level is not close to an existing level the new level is stored in the array. If the number of times that a line has been combined exceeds a user input value, the line is extended to the right.
Price: $49.95
Program 5 takes the principles used in tutorial 23 and program 3 and builds them into a strategy. Instead of drawing a dot on the chart, as the ShowMe study does, the strategy issues a market order on the next bar after a new line break 'line' begins. The strategy includes several 'template' filters so that you can easily build filters into the program.
Price: $94.95
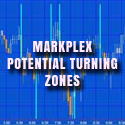
Program 15 analyzes price action in terms of both time and potential support and resistance levels on intraday charts to try and find 'zones' where, historically, price turning points have occurred.
Program 15 applied to a 1 minute GBPUSD chartThe ShowMe study works by pin-pointing significant turning points. It then analyzes both the times and price levels at which these significant turning points occur most often, keeping a record of these times and levels. Moving forward through the chart, the program analyzes each bar and if it occurs at a time and between two price levels that have been recorded, it draws a line segment, or "zone," on the chart.
Price: $119.95

This strategy uses the pivot combining methodology described in tutorial 13 such that if a new pivot is discovered that combines with a previous level, and if that level has been combined over or equal to a user input number of times, then the strategy flags a potential trade.
Commentary in program 6A further condition for entry depends on the number of combined pivots above and below the last pivot found. The program counts the number of combined pivots above the pivot that exceed a user specific weighting (specified by the line sensitivity user input - see below) and those below that exceed a specified weighting.
For a potential long trade the number of pivots below the pivot that exceed a user specified weighting must be greater than those above (that exceed a user specified weighting).
For a short trade the number of pivot lines above the pivot that exceed a user specified weighting must be greater than those below that exceed user specified weighting. The program then evaluates additional user created filters to determine whether to enter a trade. (The above explanation assumes that DirVector is set to zero)
Price: $119.95

Program 7 draws traders pivots levels on a chart based on the high, low, close and or open of a user defined session. The program offers three ways of calculating traders' pivots: Classic, Woodie, and Camarillo. Sessions are defined by user inputs which specify the start and end times and the type of traders' pivots to be calculated. This gives you total control over which period you analyze.
Price: $49.95

This program finds turning points in price action using the zig zag method. Once a new turning point is found, its price level is compared with price levels already stored in an array (if any). If the new level is within a user-specified tolerance of an existing line then the two lines are 'combined' by increasing the 'significance index' and updating the date and time associated with the level.
Price: $69.95

Program 9 is a smoothed, low-lag Commodity Channel Index (CCI) indicator. The program also includes the option to look for divergence between price and the smoothed CCI plot. If a divergence is detected, a line is drawn under the price pivots.
Price: $44.95

Program 10 takes program 9 and adds some enhancements as follows. It allows user inputs for the color of the CCI line when above the UpperLine input (in this case, it is set to 100), or below the LowerLine input (in this case it is set to -100) and between the lines. It sets an alert when the UpperLine and LowerLine lines are crossed. In additional to the divergence functionality included in Program 9, program 10 looks for divergence between the two most recent smoothed CCI pivots, and the most recent price pivot and the pivot before the second most recent price pivot.
Price: $54.95

Programs 9 and 10 are smoothed, low-lag Commodity Channel Index (CCI) TradeStation EasyLanguage indicators. Program 11 takes these programs and adds additional enhancements as follows: A new input that allows users to look for divergences between price and the smoothed fast CCI. Programs 9 and 10 ensure that the confirming pivot bar is complete before drawing the divergence line on the chart. A new user input allows the user the option of drawing a line when there is a possible divergence. The line would then disappear if the divergence. were not confirmed when the bar closes. A new input allows user the ability to look for potential divergences consisting of two CCI pivots, an initial price pivot and then a price occurring on the same bar as the second CCI pivot that indicates a possible divergence. The second price 'sampling' does not necessarily need to be a price pivot. The idea is that it could possibly give the user early warning of a divergence, prior to the price pivot occurring.
Price: $69.95

Program 12 is a TradeStation EasyLanguage strategy that searches for candlestick patterns (the specific candlestick patterns searched for depend on which user inputs are selected. If a pattern occurs and a user defined filter or user defined filters evaluate to true within a user defined number of bars, then a trade is instigated.
Price: $79.95

Program 14 is a ShowMe study that calculates zig zag patterns and stores the times at which the turning points occur in an array. Each time a new turning point is confirmed the time at which it occurred is compared with those already in the array. If the time is already in the array its 'significance index' is incremented by one. A user input determines how many lines should be drawn and the program sorts the array and draws vertical lines on the times where the most number of turning points occurred previously.
Price: $74.95

Program 13 is a strategy that looks for a pivot formation followed by a retracement before placing a limit order at the pivot price level. The strategy also allows the user to setup filters in order to easily customize the program. In the 'short' setup we look for a high pivot, for the price to dip down, then rise above the pivot level for a limit order to be placed next bar (you can also define filters to further restrict when a trade is placed.) The long setup requires a low pivot, followed by a lower low for a long limit order to be placed next bar (again, you can define filters to further restrict when trades are placed).
Price: $79.95
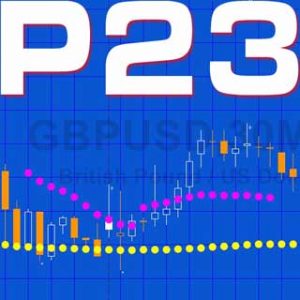
Program 23
This TradeStation EasyLanguage showme study seeks to find these moving averages and then it ‘adapts’ its moving average length according to the length of the moving average that was close to the previous high or low pivot.
The program works by, at every new high or low pivot, calculating a range of moving averages (depending on the user inputs). It then compares these moving average values (starting with the slowest, i.e. the moving average with the longest length) and if it finds one within a user defined tolerance of the pivot, it begins plotting a moving average with that length.Price: $29.95

Program 18 consists of an unprotected strategy together with a protected EasyLanguage function and a smoothed CCI indicator. The function calculates the smoothed Markplex CCI (using the calculation previously applied in programs 10 and 11) and it is called from both the strategy and the indicator. The strategy bases signals on divergence between the smoothed CCI and price. The download includes MultiCharts export files. As with the TradeStation version, the CCI function is protected. The download includes the following files: PROGRAM18.ELD, _Program18.pla and_Program18-function.sef. If you are a TradeStation user will just need to install PROGRAM18.ELD. If you are a MultiCharts user you will need to install _Program18.pla and_Program18-function.sef. Install _Program18-function.sef BEFORE _Program18.pla.
Price: $225.00

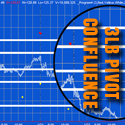
Program 17 is an unprotected TradeStation EasyLanguage Indicator which calculates traders pivots (PP, R1, R2, S1 and S2 levels) using either: Classic, Woodie, or Camarilla
formulae. The program calculates levels for the entire chart and then analyzes the data to find potential levels where there is a conflux of traders' pivot levels. Since some analysts might wish to base traders' pivot calculations on different time periods, the program also offers the flexibility of defining the period to be considered. This could be a simple stock trading session or a 24 hour session.
Price: $74.95

Program 16 is an unprotected TradeStation EasyLanguage show me study which analyzes price action in terms of both time and potential support and resistance levels on intraday charts. It attempts to find 'zones' where, historically, significant price turning points have occurred. The idea behind the program is that if turning points occur at specific times or levels previously, then, perhaps, they will occur at these times and/or levels again.
Price: $74.95
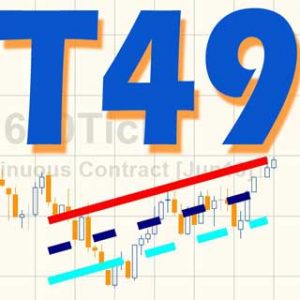
This tutorial uses the code originally created in tutorial 48 that created a line using linear regression that best fits chart data. The linear regression technique used in this tutorial uses the least squares method to calculate the slope and y-intercept of this line.
The standard deviation of the right most end of the regression line is calculated in order to create a channel made up of two parallel lines above and below the linear regression line. These lines are drawn a user input multiple of standard deviations above and below the original linear regression line.
Finally the tutorial explains how to modify the program developed in tutorial 48 to calculate the standard deviation of the linear regression line’s end point.
An updated version that allows you to modify the style, color and thickness of the lines. The two programs are included in one ELD file.
Price: $29.95