
![]() The following programs and tutorials from markplex.com are Multicharts compatible.
The following programs and tutorials from markplex.com are Multicharts compatible.
To find out more about the program click on its name. To purchase the program click ‘add to cart.’
Some of the programs are available as ELD files, while others are available as .PLA files.
Tutorial 26 | Stochastic – price divergence indicator
Tutorial 26 demonstrates is a TradeStation EasyLanguage indicator that looks for divergence between consecutive price and stochastic pivots. If potential divergence is found a line is drawn.Price: $29.95
Tutorial 27 | Markplex Pivot function
Price: $19.95
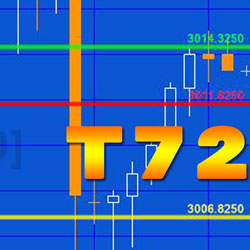
Tutorial 72 | Drawing and moving three horizontal lines
Price: $39.95

Program 24 is an indicator that looks for hidden or reverse divergence between price and the CCI rather than regular divergence.
Price: $69.95

Program 26 calculates zig-zag patterns and calculates the difference between each high and the next low, and the difference between each low and the next high. The values are 'drawn' on the chart to the appropriate number of decimal places. In addition, the program compares each downward zig zag with the previous downward zig zag. If the new downward zig zag is with a user defined tolerance of the previous downward zig zag, the thickness of the current downward zig zag is increased to a user defined value. Similarly, if the new upward zig zag is with a user defined tolerance of the previous upward zig zag, the thickness of the current upward zig zag is increased to a user defined value.
Price: $59.95

Program 30 looks for positive divergence between price and the True Strength Index (TSI). The download includes the unprotected program itself, with the following bonuses:
a user guide in PDF format
a video that describes how to easily modify the program to look for divergence between price and other oscillators (in the video I show how to convert the program to use RSI)
Program 30 works similarly to program 27 and program 28 which look for divergence between price and MACD and price and stochastics respectively. When a potential divergence is found, a line is drawn on the chart. The program also plots TSI, smoothed TSI and the difference between the two.
Price: $97.95

Program 34 uses a technique to attempt to discern market direction by filtering out price 'noise' from price action. The program analyses each bar by using a block size based on Average True Range (ATR) and counts how many of these blocks (if any, fit within the bar). The program 34 download consists of three separate programs: an indicator that plots lines based on the market direction and extremes of the blocks (_Program34-MarkplexBlocks), a show me study that plots dots when the direction changes (_Program34-ShowMe) and a support and resistance show me study that uses the levels where direction changes to attempt to ascertain levels of support and resistance (_Program34-SR).
Price: $145.95

Program 37 shows at which historic price levels gaps have occurred which have not yet been "filled" by price action. It defines gaps as when the open of a new day is different from the close of the previous day, so an up gap would occur when the open of the new day was higher then the previous close. A down gap would occur when the open of the new day was lower then the close of the previous day. Program 37 can be used with symbols such as @ES.D, @YM.D, equities or custom sessions, where gaps may occur between one daily session and the next. It can be used with intraday and tick charts. The gap information is displayed on the right of the chart as two horizontal lines and a vertical line. The number of gaps that the program recognizes is determined by a user input (up to a maximum of 100). Once a gap has been filled it is removed from the chart.
Price: $49.95

Program 38 looks for trends followed by pull backs. It attempts to highlight trends by calculating linear regression lines over several bars. If the slope is steeper than a certain amount and the average of the absolute distance between the potential trend line and the bars over which the calculation is made is less than a certain amount (I call this the 'trending coefficient' ), program 38 assumes the line is a trend. Program 38 then searches for pivots. If the end of a qualifying trend line occurs within a user defined number of bars of the pivot, and, in the case of an up trend the pivot is lower than the end of the trend line, or, in the case of a down trend the pivot is higher than the end of the trend line, then a 'dot' is plotted on the pivot confirming bar indicating a "pull back."
Price: $89.95

Program 41 looks for 'price congestion' on a chart by searching pivots that are lined up with each other. Each time a new pivot is confirmed, the program checks to see if a line can be drawn that is 'close' to going through the three most recent pivot points. Once high pivots are found the program searches to see if two low pivots have occurred after the oldest high pivot. Similarly, once low pivots are found the program searches to see if two high pivots have occurred after the oldest low pivot. Assuming the high and low pivot lines are converging, the program then draws lines through them. Show me dots are drawn to continue the lines provided they are not breached by price.
Price: $69.95

Program 25 (with plots) ADVANCED MultiCharts compatible version is a new version of program 25 that has been modified to work with Multicharts 8 with charts and the Market Scanner. It also is fully functional with TradeStation 9.0 and above. The program has the following features: a user input determines whether the candlestick patterns are indicated by text (as in the original program 25) or show-me dots, the upper and lower limits for the stochastic filter are now user inputs, a new %R filter has been added together with user input upper and lower limits
The stochastic and %R filters may be used independently or together, inputs have been created to enable users to change the background colors for cells in RadarScreen or Market Scanner
Price: $79.95
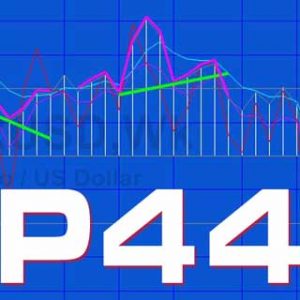
Program 44 is designed to look for ‘ghost’ patterns in the Commodity Channel Index (CCI). Some view ghost patterns as a sign of a potential reversal. The program defines a bearish ‘ghost’ pattern as one where there are 3 high pivots and the middle pivot is higher then the ones on either side.
Price: $74.95
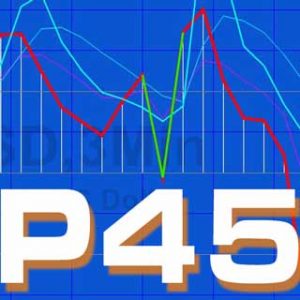
Program 45 is designed to look for ‘zero rejection’ patterns in the Commodity Channel Index (CCI). Some view zero rejection patterns as a sign of a potential reversal. The program defines a bullish zero rejection pattern as being one where price comes down from above a user defined value, to a user defined range, and then moves up above a user defined value. Similarly a bearish zero rejection pattern is defined as being one where price comes up from below a user defined value, to a user defined range, and then moves back down below the user defined value.
Price: $29.95
Program 47 (Multicharts version)
Some view ghost patterns as a sign of a potential reversal. Program 47 (based on program 44) is designed to look for ‘ghost’ patterns in the Commodity Channel Index (CCI) and make trades based on either:
A confirmed ghost or inverted ghost pattern
A break of the ‘trend line’ drawn across the ‘shoulders’ of the ghost or inverted ghost pattern
Price: $94.95

Program 20 consists of an unprotected TradeStation EasyLanguage strategy that generates trades based on the crossing of CCI 'trend' lines. Trend lines are calculated by joining CCI pivot points and then continuing the imaginary line until crossed by the CCI. In addition long trades are only instigated when the CCI is below a value specified in the user input CCILowFilter and short trades are only instigated when the CCI value is greater than a value specified in the user input CCIHighFilter. The program also includes some filters that can be easily modified by the user.
Price: $165.00

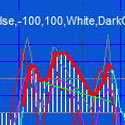
MACD (Moving Average Convergence Divergence) returns the difference between a fast and slow exponential moving average based on the same price. On a chart or RadarScreen the program plots the values for MACD (the red line in the image on the right), the exponential average of the MACD (the blue line in the image on the right) and the difference between the MACD and the exponential average of the MACD (the same as the standard MACD indicator. The program also looks for MACD divergence between price and the MACD. The user may select (by user input) whether to use: MACD, Exponential average of the MACD, or the difference between the MACD and the exponential average of the MACD when searching for divergence. When a potential divergence is found a line is drawn between price pivots corresponding to pivots in the MACD. Since price and MACD pivots do not necessarily occur on exactly the same bar, the program has a user input to determine how many bars apart the price pivot and the MACD pivot can occur. The price pivot can occur before the MACD pivot, or vice versa.
Price: $129.95

Program 28 is an Indicator developed using EasyLanguage designed to look for potential divergences between price and a stochastic oscillator. It works similar to program 27 which looks for divergence between price and MACD.
Price: $98.95

Program 42 searches for potential divergences between price and the Relative Strength Index (RSI). In addition to looking for divergence, program 42 plots RSI and an exponential moving average of RSI. When a potential divergence is found a line is drawn between price pivots corresponding to pivots in the RSI. Since price and RSI pivots do not necessarily occur on exactly the same bar, the program has a user input to determine how many bars apart the price pivot and the RSI pivot can occur. The price pivot can occur before the RSI pivot, or vice versa.
Price: $79.95
The Markplex Direction Finder is a study designed to show price ‘direction’ in price action on a chart. The program works by analyzing slope together with chart conditions based on a proprietary combination of price momentum indications. Bars are colored based on the programs‘ calculation of the price direction. User inputs determine the color that bars are painted when in a bullish or bearish direction. The program uses the GradientColor reserved word to paint bars somewhere in the range of colors between these user inputs. The colors are calculated at the end of the bar.
Price: $69.95

Program 58 | P&F, Line break, Markplex Renko and block analysis consists of a demonstration TradeStation EasyLanguage show-me study together with the following four functions:
_PandF( BoxSize, Reverse, HiLo ); (a point and figure function)
_3LB( NumberOfLinesBreak ); ( a line break function)
_MarkplexRenko( FixedBox, VariableRenkoBoxSize, FixedRenkBoxSize, HiLoMethod ) (Markplex renko function)
_MarkplexBlock( BlockTuner ); (Markplex block analysis function)
Price: $89.95