
![]() The following programs and tutorials from markplex.com are Multicharts compatible.
The following programs and tutorials from markplex.com are Multicharts compatible.
To find out more about the program click on its name. To purchase the program click ‘add to cart.’
Some of the programs are available as ELD files, while others are available as .PLA files.
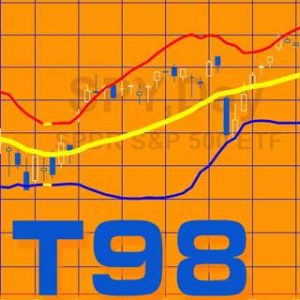
A narrowing of the Bollinger bands is an indication of lower volatility. According to John Bollinger (who created the Bollinger band concept), periods of low volatility are often followed by periods of high volatility. This could mean that a narrowing of the Bollinger bands (or a period of low volatility) –a ‘squeeze’–may foreshadow a period of higher volatility, or a breakout in price. Tutorial 98 demonstrates how to calculate and plot the Bollinger bands, as well as to calculate when the bands narrow to the point when the difference between the high Bollinger band and the low Bollinger band is the lowest in a user input number of bars.
Price: $19.95
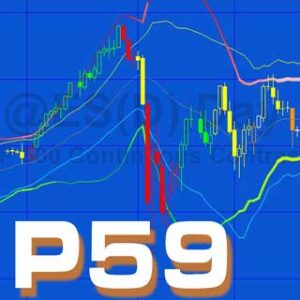
_Program59 is a TradeStation and MultiCharts indicator, written in EasyLanguage. It plots upper and lower Bollinger bands (and the average if a user input is set to true). When a 'squeeze' occurs (i.e. when the height of the Bollinger band is less than or equal to the height of a user defined number of bars, in this case the default is set to 120 bars) the upper and lower bands are plotted in a user input color (magenta in the image above). In order to give a quick visual indication to the user, the bands are also colored on a gradient between two user input colors and their thickness modified depending on the height of the Bollinger bands over a user input number of bars.
_Program59 PB paints bars as follows:
When the upper Bollinger band is above the upper Keltner channel line and the slope of the MACD is up, bars are colored according to are the AboveColor1 user input.
When the lower Bollinger band is below the lower Keltner channel line and the slope of the MACD is down, bars are colored according to are the BelowColor1 user input.
When the height of the Bollinger band is the smallest in the last NumBars bars the bars are colored according to the SqueezeColor user input.
Price: $39.95
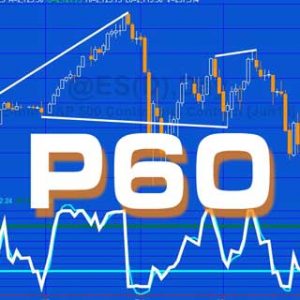
Program 60 consists of a stochastic of the RSI indicator and show me study. The stochastic of the RSI can be helpful in identifying potential tops and bottoms on a chart. The indicator also looks for divergence between price and either the stochastic of RSI or the smoothed version of the stochastic of RSI, depending on a user input. When divergence is found, lines are drawn between the price points on the chart.
Price: $49.95

Program 26 calculates zig-zag patterns and calculates the difference between each high and the next low, and the difference between each low and the next high. The values are 'drawn' on the chart to the appropriate number of decimal places. In addition, the program compares each downward zig zag with the previous downward zig zag. If the new downward zig zag is with a user defined tolerance of the previous downward zig zag, the thickness of the current downward zig zag is increased to a user defined value. Similarly, if the new upward zig zag is with a user defined tolerance of the previous upward zig zag, the thickness of the current upward zig zag is increased to a user defined value.
Price: $59.95

Program 61 consists of an indicator and the protected smoothed CCI function. The indicator plots the Markplex smoothed CCI, the Markplex fast smoothed CCI and a histogram of the Markplex smoothed CCI that is colored based on the bar volume compared to the volume of a user input number of bars. This allows the user to get an idea of whether the current bar is relatively high volume bar compared to the bars before. I explain this more in the video.
Price: $44.95

Program 37 shows at which historic price levels gaps have occurred which have not yet been "filled" by price action. It defines gaps as when the open of a new day is different from the close of the previous day, so an up gap would occur when the open of the new day was higher then the previous close. A down gap would occur when the open of the new day was lower then the close of the previous day. Program 37 can be used with symbols such as @ES.D, @YM.D, equities or custom sessions, where gaps may occur between one daily session and the next. It can be used with intraday and tick charts. The gap information is displayed on the right of the chart as two horizontal lines and a vertical line. The number of gaps that the program recognizes is determined by a user input (up to a maximum of 100). Once a gap has been filled it is removed from the chart.
Price:

_P72PivotTester
_P72PivotTester looks for unbroken support and resistance on minute and higher time frame charts.Price: $29.00

Program 54 is designed to look for a hammer candlestick pattern in a downtrend (to initiate short trades) and inverse hammer patterns in an uptrend (to initiate long trades).
Price: $129.95
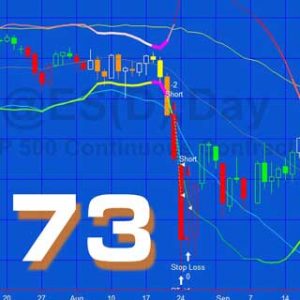
Program 59 and tutorial 98 calculate the distance between the upper and lower Bollinger bands. This was then compared with the same distance for a number of bars. If it was the least the programs recognized it as a ‘squeeze’. Program 73 is a strategy based around this concept. Because the Bollinger squeeze is not a signal by itself, I have created Program 73, a function that calculates the Bollinger squeeze and returns an integer value of the number of bars after the last squeeze occurred. A narrowing of Bollinger bands is an indication of lower volatility. According to John Bollinger, creator of the Bollinger band concept, periods of low volatility are often followed by periods of high volatility. This could mean that a narrowing of the Bollinger bands (or a period of lower volatility) –a ‘squeeze’–may foreshadow a period of higher volatility, or a breakout in price. Consequently the function could be potentially used in a strategy as one of the entry conditions.
Price: $34.95

Program 10 takes program 9 and adds some enhancements as follows. It allows user inputs for the color of the CCI line when above the UpperLine input (in this case, it is set to 100), or below the LowerLine input (in this case it is set to -100) and between the lines. It sets an alert when the UpperLine and LowerLine lines are crossed. In additional to the divergence functionality included in Program 9, program 10 looks for divergence between the two most recent smoothed CCI pivots, and the most recent price pivot and the pivot before the second most recent price pivot.
Price: $54.95
Tutorial 124, demonstrated a technique for maintaining a text label on a chart, a specific number of pixels from a price, irrespective of how the chart scaling changes. Typically this occurs when the chart scaling range is set to automatic. For a more detailed explanation of this with images, see the tutorial 124 description page.
The tutorial program is available for download with both ELD and PLA files included.
Price: $19.95
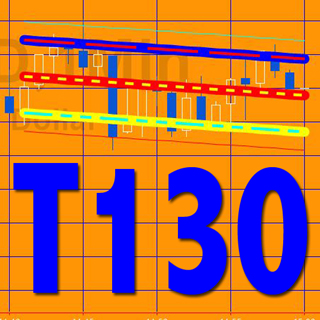
Tutorial 130 | Linear regression plot
Price: $34.95
TradeStation ELD version
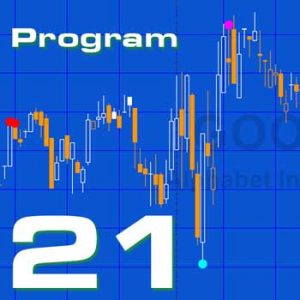
Program 21 | Turning Point Finder is a TradeStation EasyLanguage ShowMe study designed to find turning points in price action on a chart. The program works by searching for four distinct chart conditions based on a proprietary combination of the Commodity Channel Index (CCI), stochastics and price momentum. ‘Points’ are drawn on the chart at the specific bar where the conditions become true.
Price: $34.95
MultiCharts PLA version
Program 21 | Turning Point Finder is a TradeStation EasyLanguage ShowMe study designed to find turning points in price action on a chart. The program works by searching for four distinct chart conditions based on a proprietary combination of the Commodity Channel Index (CCI), stochastics and price momentum. ‘Points’ are drawn on the chart at the specific bar where the conditions become true.
Price: $34.95
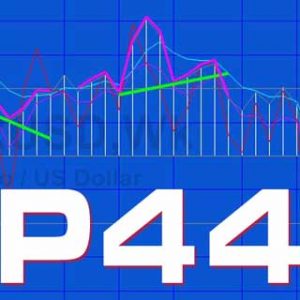
Program 44 is designed to look for ‘ghost’ patterns in the Commodity Channel Index (CCI). Some view ghost patterns as a sign of a potential reversal. The program defines a bearish ‘ghost’ pattern as one where there are 3 high pivots and the middle pivot is higher then the ones on either side.
Now includes Alert.
Price: $74.95
Tutorial 49-2 | Use bars in day
Price: $29.95

Program 38 looks for trends followed by pull backs. It attempts to highlight trends by calculating linear regression lines over several bars. If the slope is steeper than a certain amount and the average of the absolute distance between the potential trend line and the bars over which the calculation is made is less than a certain amount (I call this the 'trending coefficient' ), program 38 assumes the line is a trend. Program 38 then searches for pivots. If the end of a qualifying trend line occurs within a user defined number of bars of the pivot, and, in the case of an up trend the pivot is lower than the end of the trend line, or, in the case of a down trend the pivot is higher than the end of the trend line, then a 'dot' is plotted on the pivot confirming bar indicating a "pull back."
Price: $89.95

Program 14 is a ShowMe study that calculates zig zag patterns and stores the times at which the turning points occur in an array. Each time a new turning point is confirmed the time at which it occurred is compared with those already in the array. If the time is already in the array its 'significance index' is incremented by one. A user input determines how many lines should be drawn and the program sorts the array and draws vertical lines on the times where the most number of turning points occurred previously.
Price: $74.95
Tutorial 32
Price: $29.95