
Flexible Zig zag functions with Fibonacci detection option
The Program 70 package that consists of two functions and three demonstration show me studies that call one or the other function. These new functions allow a user to build zig zags from a calculated series, such as a moving average (Zig zags on this site have, thus far, been built using high price pivots and low price pivots. These new functions allow you to replace using price high and price low with other calculated values.)
The programs are summarized in the following table:
| Function | Display Zig-Zag lines | Calculate Fibonacci relationships | Demonstration programs | Free for Gold Pass members |
|---|---|---|---|---|
| _ZigZagDisplay | YES | NO | _ZigZagDisplayTest | YES |
| _ZigZag | YES | YES | _ZigZagTestSimple _ZigZagTest | NO |
The two functions, _ZigZagDisplay and _ZigZag, include the same core zig zag functionality, but the _ZigZag function also includes algorithms to detect whether ratios of the price increase/decrease consecutive zig zags are equal to (or close to) a Fibonacci ratio.
Calling the _ZigZagDisplay function (the function that doesn’t include the Fibonacci detection)
The _ZigZagDisplay function is called as follows:
// Enter the value to be checked here:
HiVal = AverageFC( H, 9 ); // The HIGH value
LoVal = AverageFC( L, 9 ); // The LOW value

// Call the _ZigZagDisplay function
Value1 = _ZigZagDisplay( HiVal, LoVal, 3 {Left strength of pivots},
3 {Right strength of pivots}, 0.2 {RetracePerc}, "White" {ZigZagColUp},
"Orange" {ZigZagColDn}, "White" {ColorOfText}, 3 {Thickness},
"Ariel" {Font}, 18 {FontSize} );
HiVal. This could be replaced with High (to use high price pivots) or another calculation like AverageFC( H, 4 ).
LoVal. This could be replaced with Low (to use low price pivots) or another calculation like AverageFC( L, 4 ).
HiVal and LoVal can both be set to the same values. I demonstrate this in the video below.
RetracePerc is the percentage above or below a ‘running’ pivot that pivot must be formed to start a new zig zag
ZigZagColUp and ZigZagColDn are the colors of up and down zig zag lines respectively (see the program web page for available colors)
ColorOfText is the color of number label
Thickness is the thickness of the lines drawn on the chart
Font is the font for text objects
FontSize is the font size for text objects
Calling the _ZigZag function (the function that includes the Fibonacci detection)
// Call the _ZigZag function
Value1 = _ZigZag( HiVal, LoVal, LStrength, RStrength,
RetracePerc, ZigZagColUp, ZigZagColDn, CheckForFib,
Tolerance, ColorOfText, LineThickness, Font, FontSize,
MaxVectorCount, UpMoves, DnMoves, HiZZ, LoZZ );
With the following inputs:
HiVal. This could be replaced with High (to use high price pivots) or another calculation like AverageFC( H, 4 ).
LoVal. This could be replaced with Low (to use low price pivots) or another calculation like AverageFC( L, 4 ).
HiVal and LoVal can both be set to the same values. I demonstrate this in the video below.
LStrength is the left strength of the pivots
RStrength is the right strength of the pivots
RetracePerc is the percentage above or below a ‘running’ pivot that pivot must be formed to start a new zig zag
ZigZagColUp and ZigZagColDn are the colors of up and down zig zag lines respectively (see the program web page for available colors)
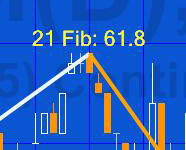
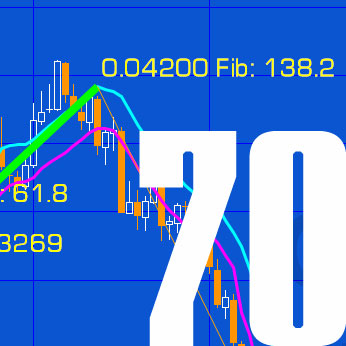
If CheckForFib is set to TRUE the function will look for Fibonacci releationships between the ratio of the last up and down zig zags. If a match is found the zig zag line is drown with a thickness of LineThickness. The ratio is printed near the end of the last zig zag.
Both Fibonacci retracements and extensions (projections) are looked for. The following ratios are compared in the calculation:
- 38.2
- 61.8
- 100.0
- 138.2
- 161.8
Tolerance is used in the Fibonacci calculation. It is the percentage tolerance calculating a range above and below last change.
ColorOfText is the color of number label
Font is the font for text objects
FontSize is the font size for text objects
MaxVectorCount is the maximum number of elements in the UpMoves, DnMoves, HiZZ, and LoZZ vectors that are returned if CheckForFib is set to TRUE.

Data returned by the _ZigZag function
If CheckForFib is set to TRUE the function populates and returns 4 vectors:
DnMoves. Each time a new down move is confirmed it is added to the DnMoves vector. Once the vector reaches MaxVectorCount and a new element is added, the oldest element is deleted.
HiZZ. Each time a new high pivot occurs its bar number is stored in the HiZZ vector. Once the vector reaches MaxVectorCount and a new element is added, the oldest element is deleted.
LoZZ. Each time a new low pivot occurs its bar number is stored in the LoZZ vector. Once the vector reaches MaxVectorCount and a new element is added, the oldest element is deleted.
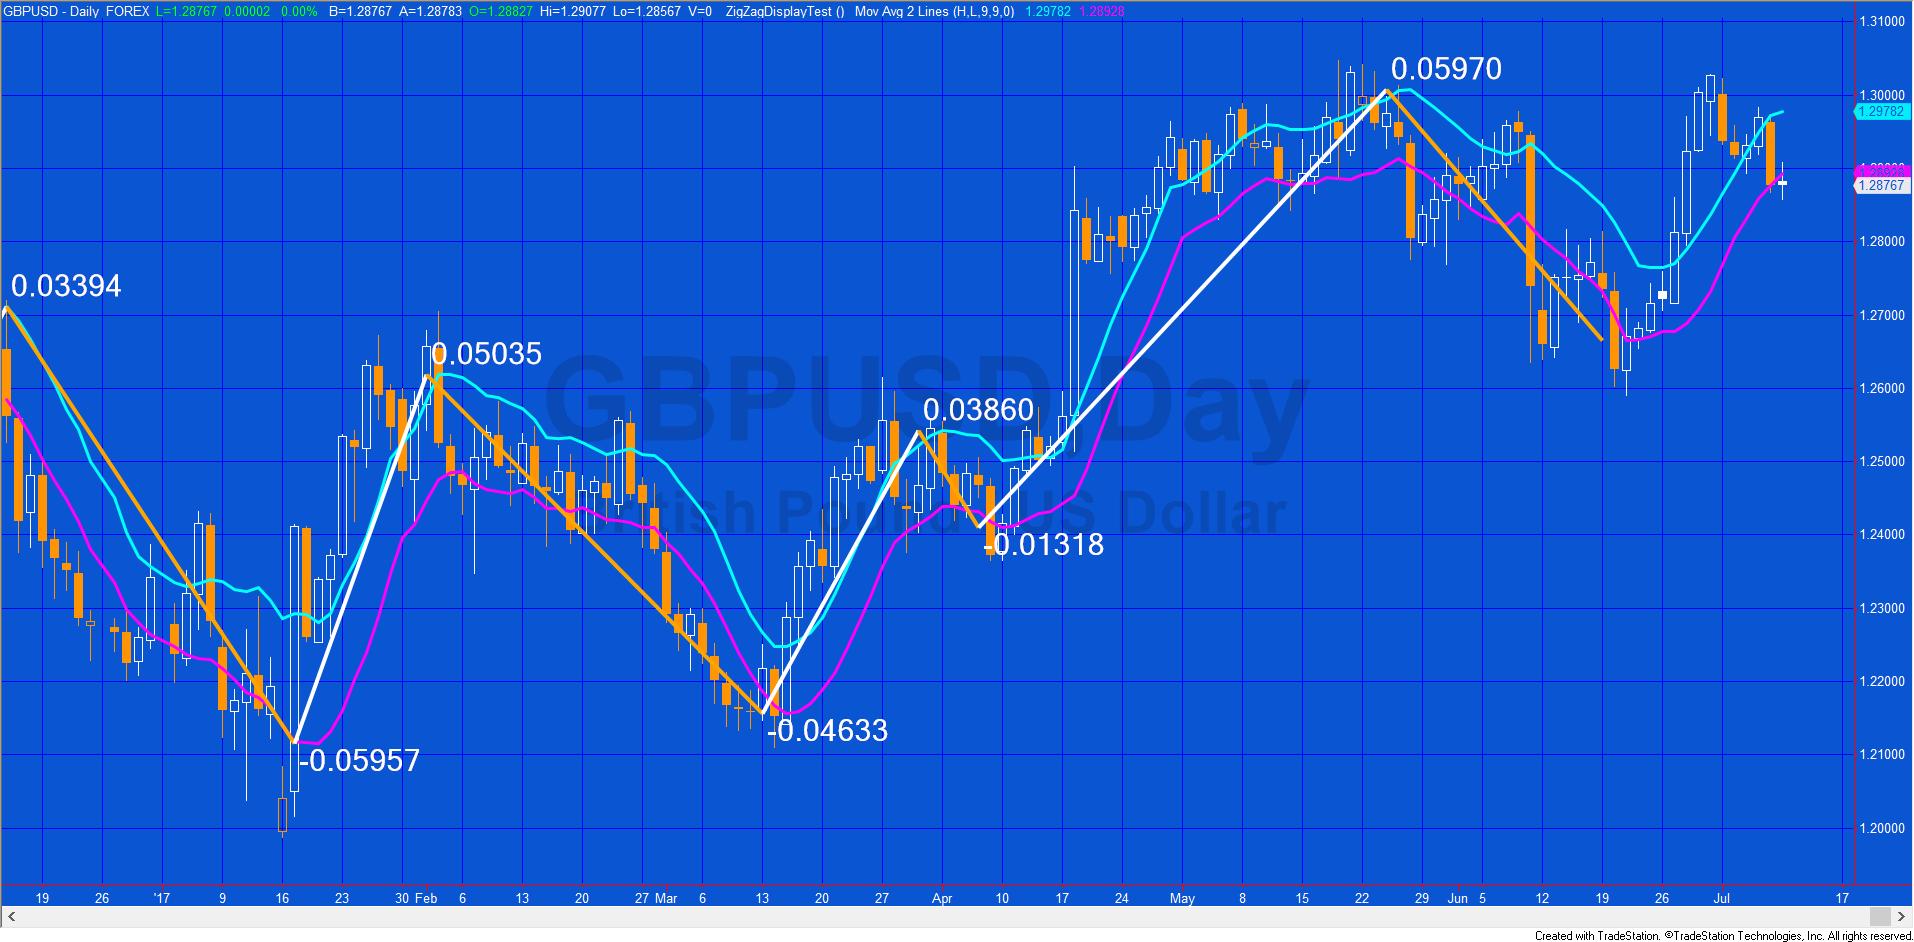
The _ZigZagDisplayTest show me study calling the _ZigZagDisplay function
Vars: double HiVal( 0 ), double LoVal( 0 );
// Enter the value to be checked here:

HiVal = AverageFC( H, 9 ); // The HIGH value

LoVal = AverageFC( L, 9 ); // The LOW value

// Call the _ZigZagDisplay function

Value1 = _ZigZagDisplay( HiVal, LoVal, 3 {Left strength of pivots}, 3 {Right strength of pivots}, 0.2 {RetracePerc}, "White" {ZigZagColUp}, "Orange" {ZigZagColDn}, "White" {ColorOfText}, 3 {Thickness}, "Ariel" {Font}, 18 {FontSize} );
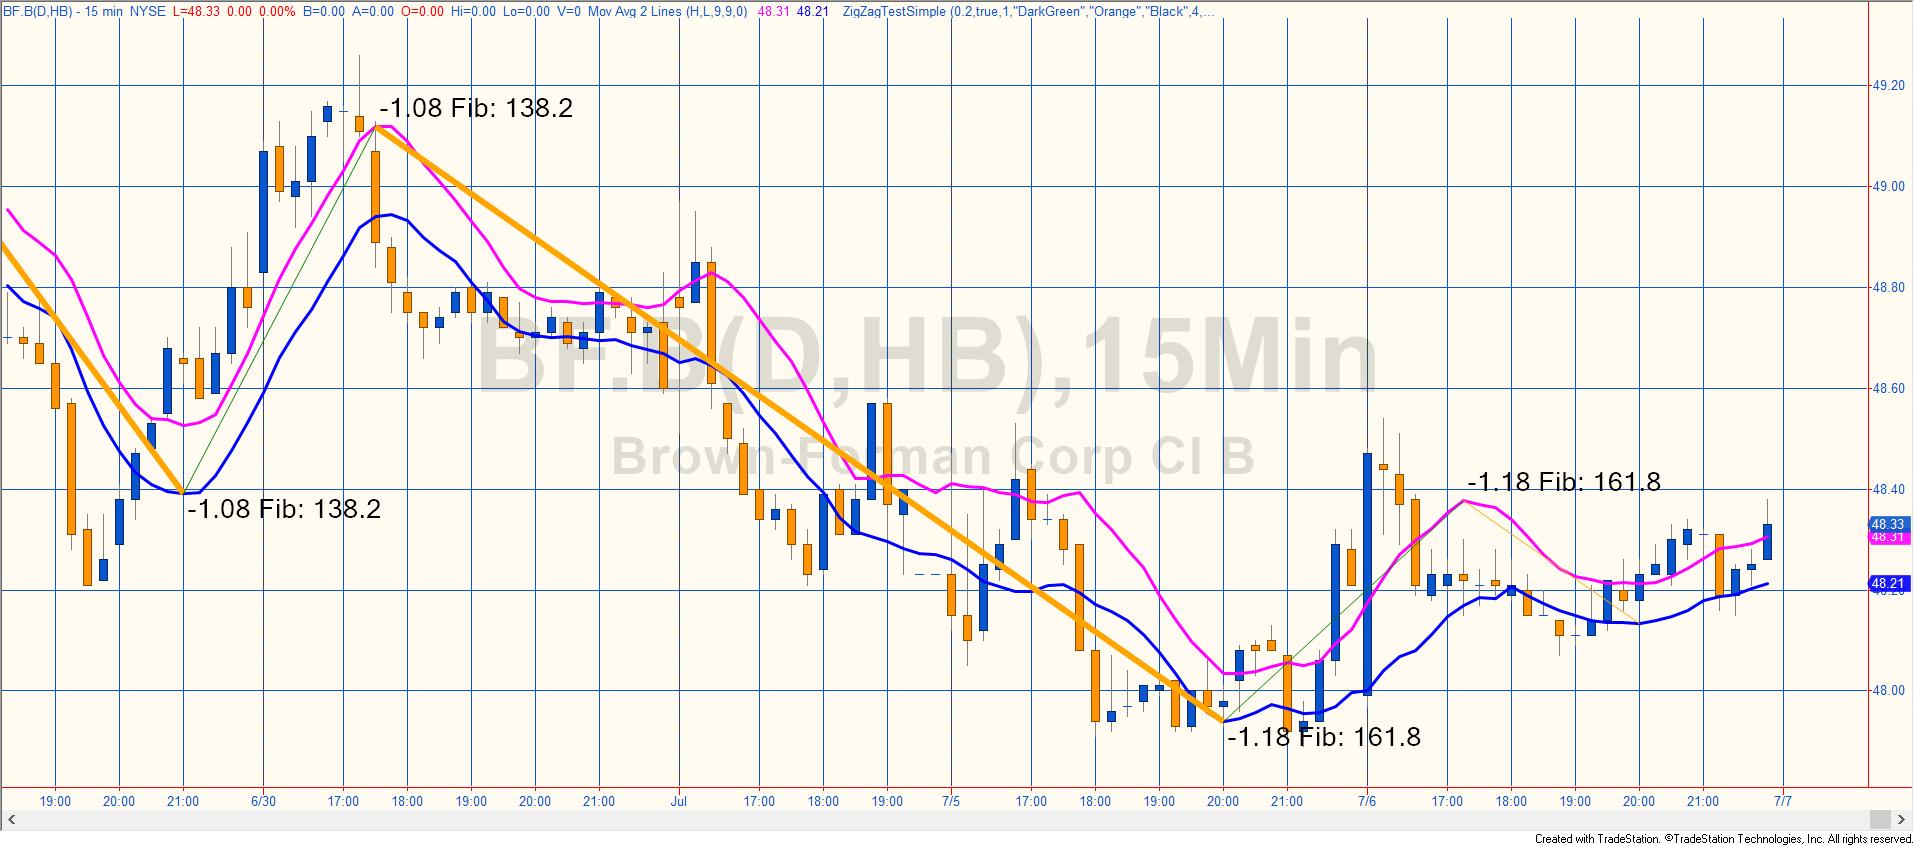
The _ZigZagTest show me study to call the _ZigZag function
// Namespaces
using elsystem ;
using elsystem.collections ;

Input: double RetracePerc( 0.2 ), // Percentage above running pivot that pivot must be formed to start a new zig zag
int LStrength( 3 ), // Left pivot strength
int RStrength( 3 ), // Right pivot strength

bool CheckForFib( false ), // Perform check for Fibonacci ratios
double Tolerance( 10 ), // Percentage tolerance when calculating how close ratio is to Fib ratio

string ZigZagColUp( "DarkGreen" ), // Color of up zig zag line (see the program web page for available colors)
string ZigZagColDn( "Orange" ), // Color of up zig zag line
string ColorOfText( "Black" ), // Color of number label
int LineThickness( 4 ), // Thickness of line if new zig zag if close to a Fibonacci ratio
int MaxVectorCount( 100 ), // The maximum number of elements in the UpMoves, DnMoves, HiZZ, and LoZZ vectors
string Font( "Ariel" ), // Font for text objects
double FontSize( 16 ); // Font size for text objects

Vars: double HiVal( 0 ),
double LoVal( 0 ),

Vector UpMoves( Null ),
Vector DnMoves( Null ),
Vector HiZZ( Null ),
Vector LoZZ( Null );

// First piece of code that is run when applied to a chart or is reinitialized
Once
begin
UpMoves = new Vector;
DnMoves = new Vector;
HiZZ = new Vector;
LoZZ = new Vector;
end ;

// Enter the value to be checked here:
HiVal = AverageFC( H, 9 ); // The HIGH value
LoVal = AverageFC( L, 9 ); // The LOW value

// Call the _ZigZag function
Value1 = _ZigZag( HiVal, HiVal, LStrength, RStrength, RetracePerc, ZigZagColUp, ZigZagColDn, CheckForFib, Tolerance, ColorOfText, LineThickness, Font, FontSize, MaxVectorCount, UpMoves, DnMoves, HiZZ, LoZZ );
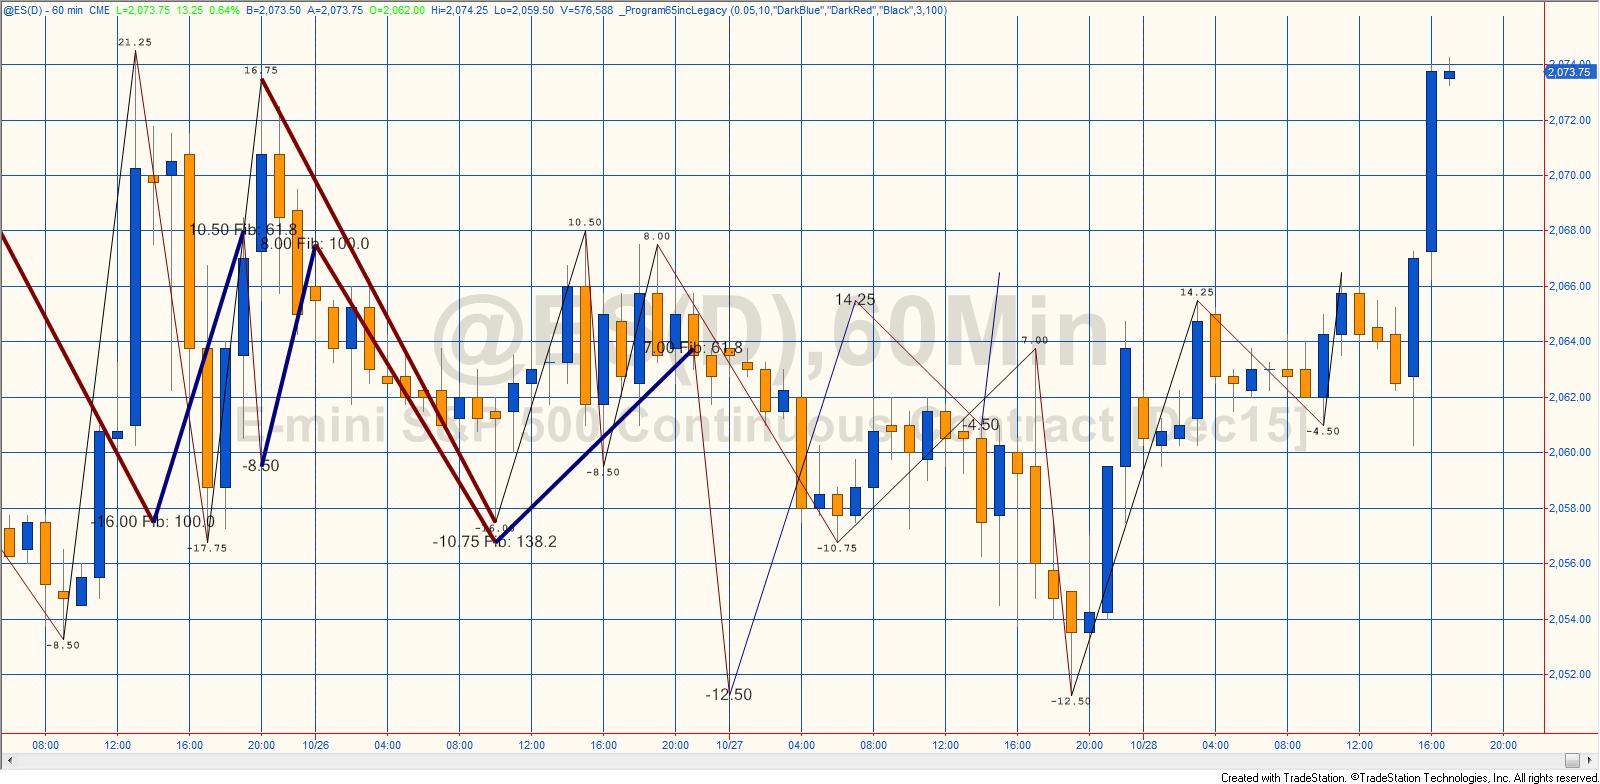
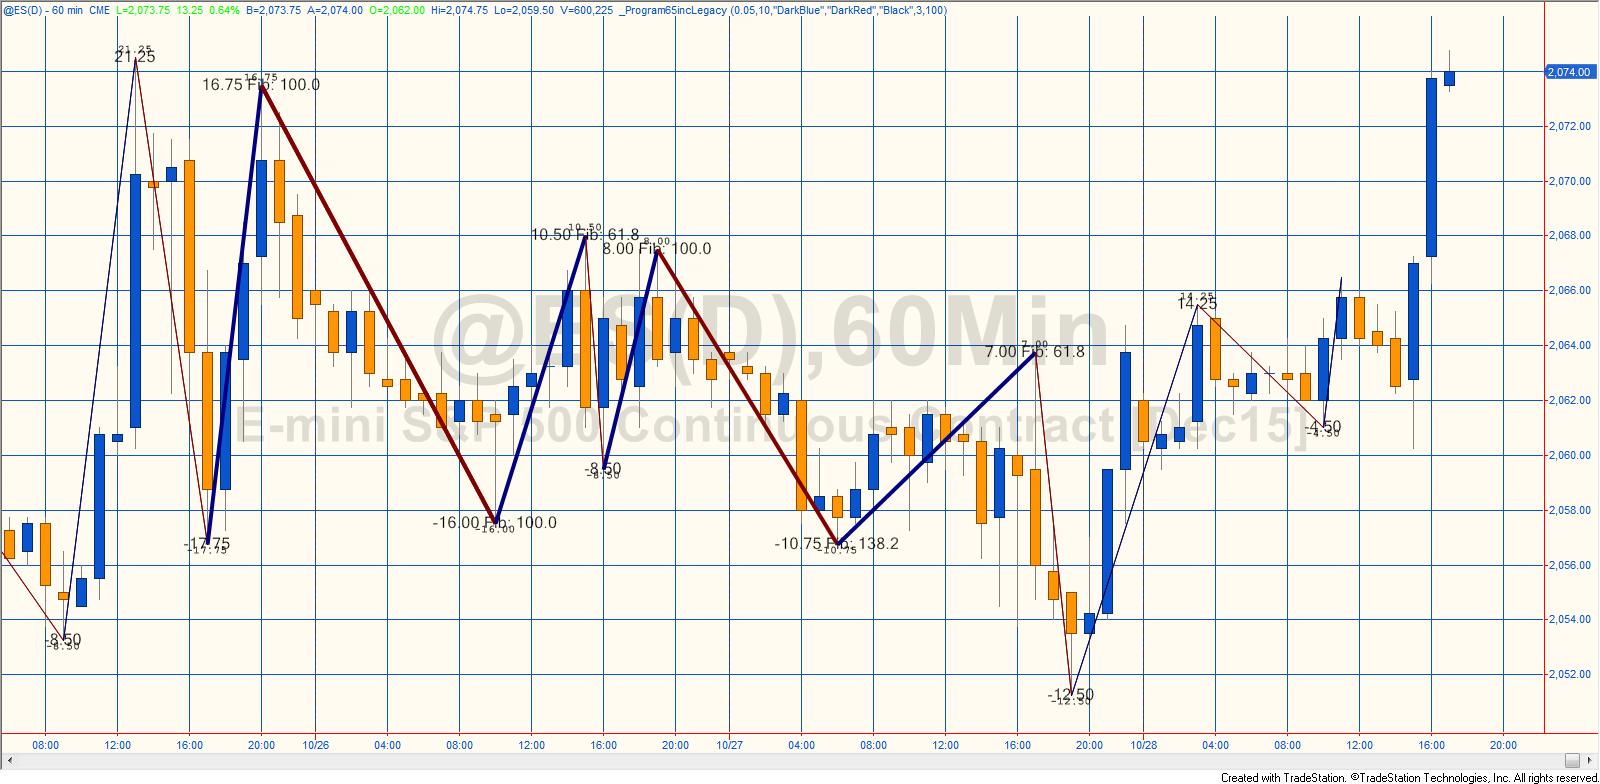
When the function is called it calculates and draws zig zag lines on the chart together with text at the zig zag pivots. The text shows the vertical height of each zig zag leg. With the _ZigZag function, if the CheckForFib input is set to true and the vertical ratio of two most recent zig zag lines is close to a Fibonacci ratio, text is also displayed to show which Fibonacci ratio it is close to and the zig zag line is drawn with a heavier weight (also specified by a user input: LineThickness.)
Accessing data in the returned vectors
The DnMoves vector contains the last MaxVectorCount down moves. The most recent can be accessed using DnMoves.items[0] astype double
The HiZZ vector contains the bar numbers of the last MaxVectorCount high zig zag pivots. The most recent can be accessed using HiZZ.items[0] astype int, the second most recent can be accessed using HiZZ.items[1] astype int etc
The LoZZ vector contains the bar numbers of the last MaxVectorCount low zig zag pivots. The most recent can be accessed using LoZZ.items[0] astype int
Before attempting to access an element of a vector it is important to check that the element exists by taking a count of the vector. This is achieved by using LoZZ.Count.
The function does not contain a mechanism for regulating the number of text objects on the chart.
Make sure that ‘Show empty daily trading periods for traditional chart types’ and ‘Show empty intraday session periods for traditional chart types’ are not selected. These can be found by clicking View – Chart Analysis Preferences
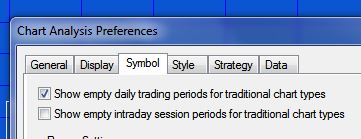
If these are selected, the chart includes blank bars which ‘confuse’ the bar number for BNPoints. For example, in the following daily chart of IBM, the ‘Show empty daily trading periods for traditional chart types’ is selected. The chart looks like the following (notice how the pivots and the lines do not line up correctly):
In the following chart all settings are identical apart from “Show empty intraday session trading periods for traditional chart types” is deselected.
Note that vectors do not store a history. In other words, you cannot look back 5 bars and see what the vector was storing then (like you could with an array).
Program 70 was developed for TradeStation 9.5 and above and is not compatible with MultiCharts because of some of the drawing technology used.
Program download
[download_box]The UNPROTECTED functions (i.e. the TradeStation EasyLanguage is fully functional and you can see the source code) and three associated showme studies that demonstrate how to call the function are available for for IMMEDIATE download for $49- by clicking the ‘add to cart’ button.
After download the program can be opened, you will be able to see the program code and modify it. After purchase you will be redirected to a download page, so don’t close the browser.
The programs included in the download ELD are:
- _ZigZagDisplay (a function)
- _ZigZagDisplayTest (a showme study that calls _ZigZagDisplay)
- _ZigZag (a function)
- _ZigZagTestSimple (a showme study that calls _ZigZag)
- _ZigZagTest (a showme study that calls _ZigZag)
If you are a Gold Pass member make sure you enter the special coupon code to get 20% discount off these prices. Alternatively _ZigZagDisplay is available at no cost in the Gold Pass area below.
[/download_box]
Video demonstration of program 70
Program 70 was developed for TradeStation 9.5 and above, including version 10 and is not compatible with MultiCharts.
_ZigZagDisplay_w_dir and _ZigZagDisplayTest_w_dir
_ZigZagDisplay_w_dir takes the original _ZigZagDisplay program and makes the function return the Piv Direction, i.e.
_ZigZagDisplay = 0; // The name of the function must have a value assigned to it. In this case an arbitrary value
with:
_ZigZagDisplay_w_dir = PivDirection;
In additon various drawing object statements were added to the code to demonstrate how the zig zag works. See QuickTip 41 for a video explanation.
Gold Pass area
Color options
| AliceBlue | DarkSlateGray | LightSalmon | PaleVioletRed |
| AntiqueWhite | DarkTurquoise | LightSeaGreen | PapayaWhip |
| Aqua | DarkViolet | LightSkyBlue | PeachPuff |
| Aquamarine | DeepPink | LightSlateGray | Peru |
| Azure | DeepSkyBlue | LightSteelBlue | Pink |
| Beige | DimGray | LightYellow | Plum |
| Bisque | DodgerBlue | Lime | PowderBlue |
| Black | Firebrick | LimeGreen | Purple |
| BlanchedAlmond | FloralWhite | Linen | Red |
| Blue | ForestGreen | Magenta | RosyBrown |
| BlueViolet | Fuschia | Maroon | RoyalBlue |
| Brown | Gainsboro | MediumAquamarine | SaddleBrown |
| Burlywood | GhostWhite | MediumBlue | Salmon |
| CadetBlue | Gold | MediumOrchid | SandyBrown |
| Chartreuse | Goldenrod | MediumPurple | SeaGreen |
| Chocolate | Gray | MediumSeaGreen | Seashell |
| Coral | Green | MediumSlateBlue | Sienna |
| CornflowerBlue | GreenYellow | MediumSpringGreen | Silver |
| Cornsilk | Honeydew | MediumTurquoise | SkyBlue |
| Cyan | HotPink | MediumVioletRed | SlateBlue |
| DarkBlue | IndianRed | MidnightBlue | SlateGray |
| DarkBrown | Indigo | MintCream | Snow |
| DarkCyan | Ivory | MistyRose | SpringGreen |
| DarkGoldenrod | Khaki | Moccasin | SteelBlue |
| DarkGray | Lavender | NavajoWhite | Tan |
| DarkGreen | LavenderBlush | Navy | Teal |
| DarkKhaki | LawnGreen | OldLace | Thistle |
| Dark Magenta | LemonChiffon | Olive | Tomato |
| DarkOliveGreen | LightBlue | OliveDrab | Turquoise |
| DarkOrange | LightCoral | Orange | Violet |
| DarkOrchid | LightCyan | OrangeRed | Wheat |
| DarkRed | LightGoldenrodYellow | Orchid | White |
| DarkSalmon | LightGray | PaleGoldenrod | WhiteSmoke |
| DarkSeaGreen | LightGreen | PaleGreen | Yellow |
| DarkSlateBlue | LightPink | PaleTurquoise | YellowGreen |
For zig zag based programs see:


Please note that any screen shots on this site are examples and are not meant to imply that any of these programs will generate profitable trades.
THESE INDICATORS, SHOW ME STUDIES, STRATEGIES AND OTHER PROGRAMS HAVE BEEN INCLUDED SOLELY FOR EDUCATIONAL PURPOSES.
TO THE BEST OF MARKPLEX CORPORATION’S KNOWLEDGE, ALL OF THE INFORMATION ON THIS PAGE IS CORRECT, AND IT IS PROVIDED IN THE HOPE THAT IT WILL BE USEFUL. HOWEVER, MARKPLEX CORPORATION ASSUMES NO LIABILITY FOR ANY DAMAGES, DIRECT OR OTHERWISE, RESULTING FROM THE USE OF THIS INFORMATION AND/OR PROGRAM(S) DESCRIBED, AND NO WARRANTY IS MADE REGARDING ITS ACCURACY OR COMPLETENESS. USE OF THIS INFORMATION AND/OR PROGRAMS DESCRIBED IS AT YOUR OWN RISK.
ANY EASYLANGUAGE OR POWERLANGUAGE TRADING STRATEGIES, SIGNALS, STUDIES, INDICATORS, SHOWME STUDIES, PAINTBAR STUDIES, PROBABILITYMAP STUDIES, ACTIVITYBAR STUDIES, FUNCTIONS (AND PARTS THEREOF) AND ASSOCIATED TECHNIQUES REFERRED TO, INCLUDED IN OR ATTACHED TO THIS TUTORIAL OR PROGRAM DESCRIPTION ARE EXAMPLES ONLY, AND HAVE BEEN INCLUDED SOLELY FOR EDUCATIONAL PURPOSES. MARKPLEX CORPORATION. DOES NOT RECOMMEND THAT YOU USE ANY SUCH TRADING STRATEGIES, SIGNALS, STUDIES, INDICATORS, SHOWME STUDIES, PAINTBAR STUDIES, PROBABILITYMAP STUDIES, ACTIVITYBAR STUDIES, FUNCTIONS (OR ANY PARTS THEREOF) OR TECHNIQUES. THE USE OF ANY SUCH TRADING STRATEGIES, SIGNALS, STUDIES, INDICATORS, SHOWME STUDIES, PAINTBAR STUDIES, PROBABILITYMAP STUDIES, ACTIVITYBAR STUDIES, FUNCTIONS AND TECHNIQUES DOES NOT GUARANTEE THAT YOU WILL MAKE PROFITS, INCREASE PROFITS, OR MINIMIZE LOSSES.