
Support and resistance analysis of pivots using a dictionary

There are several programs and tutorials at markplex.com that seek to store pivot levels and keep a tally of how many times a level has fallen at or near to a new pivot (I have included links to several programs in the box below). The basic idea is that if price turning points continue to happen near a particular level, then, perhaps, there is a support and resistance zone at or near that level.
Other support and resistance related programs/tutorials
Program 55 | Support and resistance lines based on historical pivots
Program 50 | Point and figure turning points and support and resistance
Tutorial 84 | Looking for support and resistance levels
Tutorial 13 | Support and resistance lines based on historical pivots
Program 16 | Support and resistance levels combined with time zones
Program 15 | Markplex Potential Turning Zones
Program 8 | Zig Zag Conflux Showme
Program 6 | Pivot confluence strategy
Program 2 | Pivot-confluence show-me study
Program 72 | PivotTester
This implementation of a similar idea uses the dictionary class to try and increase the efficiency of the program and also provide some more tutorial resources in terms of how to program using the dictionary class.
The Dictionary Class defines the structure of an object as a collection of key/value (index/value) pairs that let you save values for use by a single EasyLanguage analysis techniques (indicator, paintbar study, showme study etc) or strategy. The structure is similar to a real dictionary where the word that we are searching for is the key or index and the definition of the word is the value.
In tutorial 123 we convert the level where a pivot occurs to a string and use it as the ‘key’ and the number of times that a pivot has occurred at that pivot level as the value. This means that while the levels are added to the dictionary in no particular order, we can quickly get the number of times that a pivot has occurred at a particular level by querying the dictionary with the pivot level value.
There are two versions of the program that will be discussed:
- _Tutorial123 Simple has been designed to be as simple as possible to demonstrate how the dictionary is being used. The program is limited in that it runs once when first applied to the chart and then, if you wish it to recalculate, you have to refresh the chart. _Tutorial123 Simple is available for download and is available for free to Gold Pass members.
- _Tutorial123 Advanced is a more complex program that updates the lines when new pivots are found, can distinguish different weights by coloring the lines differently, and it used methods and vectors more extensively. This program is also available for download.
Both versions include the Markplex vector sort function: _VectorQuickSort (value $19.95) which is included in the downloads below.
How _Tutorial123 Simple works
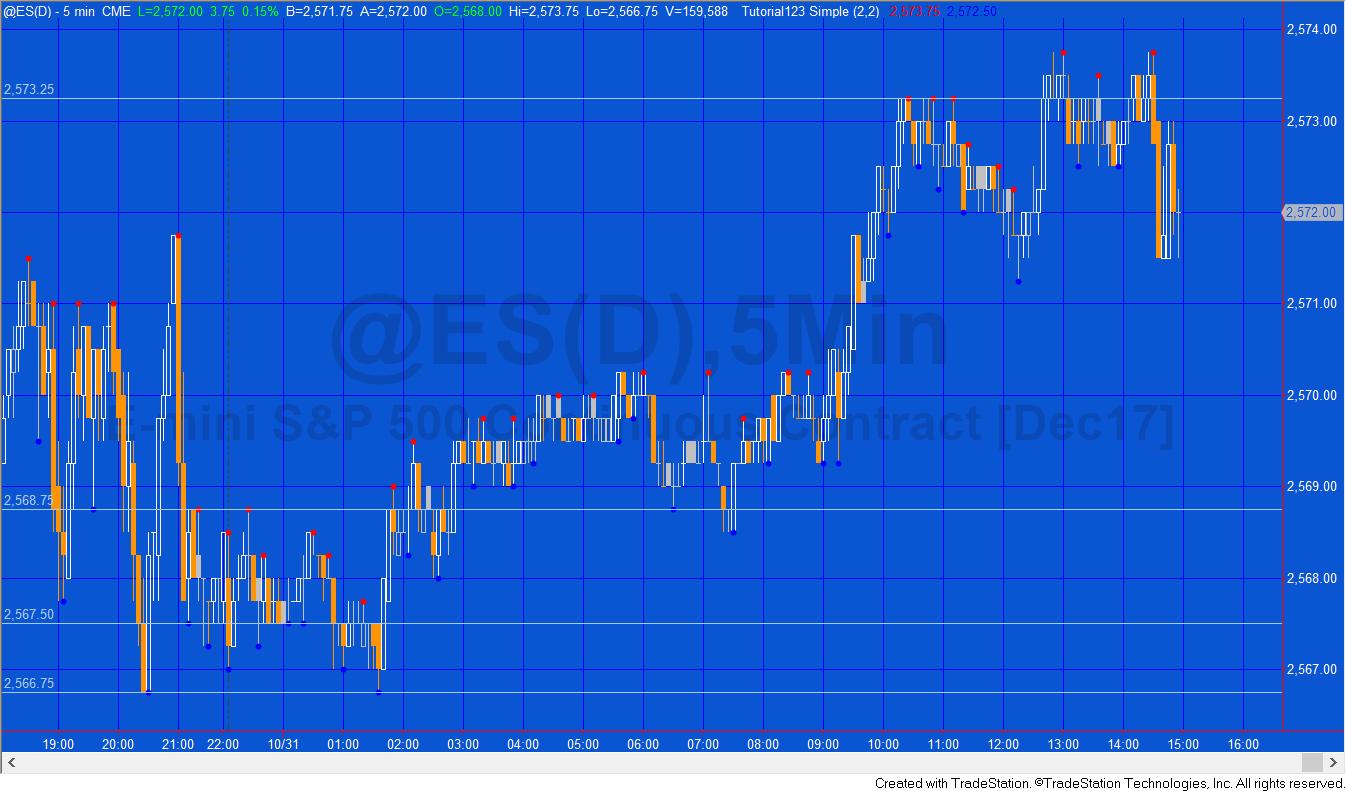
The program goes through the chart looking for high and low pivot using the standard Pivot function. Once a pivot is found the dictionary is queried to see if one or more pivots have occurred at this level before. If so the value is incremented by one, if not, a new key / value pair is added to the dictionary with a value of 1. The pivot is also plotted on the chart.
On the first tick of the last bar the dictionary is analyzed. Firstly the values are copied into a vector and this is sorted using the recursive Markplex vector-sort-function. We then loop through the dictionary and for levels where the value is greater than the value in the 9th element of the sorted vector we create a horizontal line and add it to the chart. This occurs once.
The program analyzes all the bars on the chart and so the user can adjust how far back he wants to look in terms of his analysis.
Programming lessons in _Tutorial123 Simple
The tutorial demonstrates how to:
- Create a dictionary and vector
- Add a key/value pair to the dictionary
- Use a for loop to go through the dictionary
- Copy the values into a values vector
- Count the number of elements in the dictionary
- Avoid ‘Vector is empty or invalid index’ errors
- Sort the vector using the recursive Markplex _VectorQuickSort function by passing a vector to a function
- How to recognize the first tick of a bar
- Adding horizontal line drawing objects to the chart
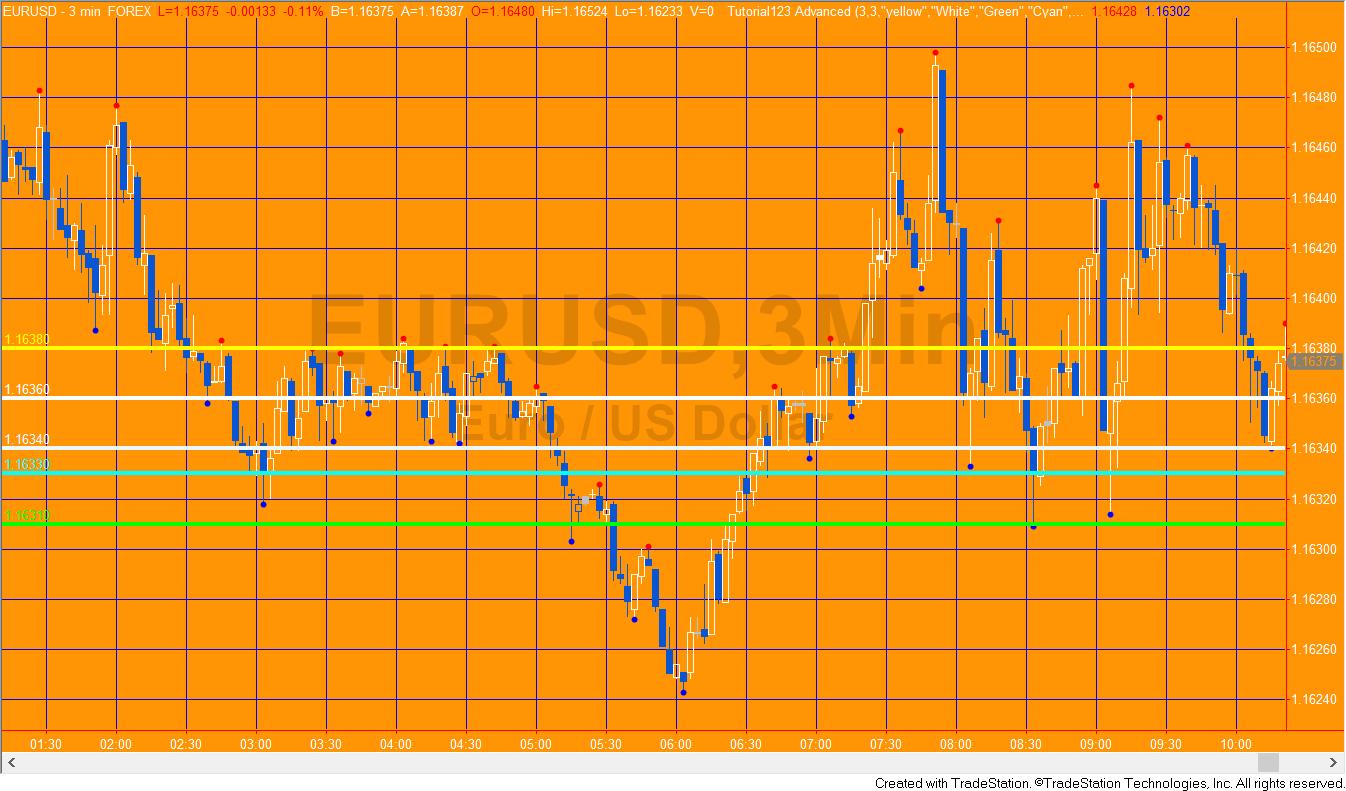
How _Tutorial123 Advanced works
Like _Tutorial123 Simple, the advanced version of the program also goes through the chart looking for high and low pivots using the standard TradeStation Pivot function. Once a pivot is found the dictionary is queried to see if one or more pivots have previously occurred at this level. If so, the value is incremented by one, if not, a new key / value pair is added to the dictionary with a value of 1. The pivot is also plotted on the chart.
On the first tick of the last bar the dictionary is analyzed. Firstly the values are copied into a vector and this is sorted using the recursive Markplex vector-sort-function. We then loop through the dictionary and for levels where the value is greater than the value in the 9th element of the sorted vector we create a horizontal line and add it to the chart.
The program then continues to check for new pivots on real time bars and adds them to the dictionary. Every time a new pivot is found the program re-analyzes the dictionarya and a horizontal line if the value or strength of the level is greater than the value in the 9th element of the sorted vector.
In addition the program analyzes the levels and assigns a color depending on the user inputs and the strength of the level. Fore example, if the sorted levels show strengths (i.e. the number of times they have occurred) of 35, 32, 32, 32, 30, 25, 25,25, 19, 19, 17,,10,10….these will be analyzed on the levels vector populated with 35, 32, 30, 25, 19, 17, 10. A colors dictionary is created and lines with strength 35 will be colored Color1, lines with strength 32 will be colored Color2, lines with strength 30 will be colored Color3 etc.
Programming lessons in _Tutorial123 Advanced
In addition to the programming lessons listed under _Tutorial123 Simple, the advanced program also contains the following lessons:
- Creating and calling a simple method as a way of avoiding repeating code
- Using two dictionaries
- Adding all the drawing objects of a certain type to a vector
- Deleting drawing objects from a chart
- Changing the color of a horizontal line drawing object
The code is available free to Gold Pass members (see below). After download the programs can be opened, you will be able to see the program code and modify it if you wish. After purchase you will be redirected to a download page, so don’t close the browser. _Tutorial123 Advanced is also available for IMMEDIATE download for $34.95- by clicking the ‘add to cart’ button. The program works with TradeStation but not with Multicharts. After purchase you will be redirected to a download page, so don’t close the browser. _Tutorial123 Simple and _Tutorial123 Advanced are available together as a bundle for a reduced fee of $44.95- by clicking the ‘add to cart’ button. The programs works with TradeStation but not with Multicharts. After purchase you will be redirected to a download page, so don’t close the browser.
Video explanation of tutorial 123 Part 1
Video explanation of tutorial 123 Part 2 | Introduction to the advanced program
Note that a chart with a great many line of the same color might indicate that there are no clear support and resistance levels or that the user has too much history loaded for an instrument that is is a cycle period.
Gold Pass area
Make sure that you are logged in then click the following button to download _Tutorial123 Simple at no cost.
THESE INDICATORS, SHOW ME STUDIES, STRATEGIES AND OTHER PROGRAMS HAVE BEEN INCLUDED SOLELY FOR EDUCATIONAL PURPOSES.
TO THE BEST OF MARKPLEX CORPORATION’S KNOWLEDGE, ALL OF THE INFORMATION ON THIS PAGE IS CORRECT, AND IT IS PROVIDED IN THE HOPE THAT IT WILL BE USEFUL. HOWEVER, MARKPLEX CORPORATION ASSUMES NO LIABILITY FOR ANY DAMAGES, DIRECT OR OTHERWISE, RESULTING FROM THE USE OF THIS INFORMATION AND/OR PROGRAM(S) DESCRIBED, AND NO WARRANTY IS MADE REGARDING ITS ACCURACY OR COMPLETENESS. USE OF THIS INFORMATION AND/OR PROGRAMS DESCRIBED IS AT YOUR OWN RISK.
ANY EASYLANGUAGE OR POWERLANGUAGE TRADING STRATEGIES, SIGNALS, STUDIES, INDICATORS, SHOWME STUDIES, PAINTBAR STUDIES, PROBABILITYMAP STUDIES, ACTIVITYBAR STUDIES, FUNCTIONS (AND PARTS THEREOF) AND ASSOCIATED TECHNIQUES REFERRED TO, INCLUDED IN OR ATTACHED TO THIS TUTORIAL OR PROGRAM DESCRIPTION ARE EXAMPLES ONLY, AND HAVE BEEN INCLUDED SOLELY FOR EDUCATIONAL PURPOSES. MARKPLEX CORPORATION. DOES NOT RECOMMEND THAT YOU USE ANY SUCH TRADING STRATEGIES, SIGNALS, STUDIES, INDICATORS, SHOWME STUDIES, PAINTBAR STUDIES, PROBABILITYMAP STUDIES, ACTIVITYBAR STUDIES, FUNCTIONS (OR ANY PARTS THEREOF) OR TECHNIQUES. THE USE OF ANY SUCH TRADING STRATEGIES, SIGNALS, STUDIES, INDICATORS, SHOWME STUDIES, PAINTBAR STUDIES, PROBABILITYMAP STUDIES, ACTIVITYBAR STUDIES, FUNCTIONS AND TECHNIQUES DOES NOT GUARANTEE THAT YOU WILL MAKE PROFITS, INCREASE PROFITS, OR MINIMIZE LOSSES.