Welcome to the Markplex.com email list. You have successfully subscribed!
If you ever wish to unsubscribe, please enter you e-mail address into the form on the right.
Our list of tutorials and programs has grown to be fairly sizable. I have provided a summary below.
Some of the tutorials and all of the programs are available for download for a nominal fee. You may pay by credit card or Paypal, but you do not need to have a Paypal account nor do you need to open one in order to make a payment by credit card.
The following are a few areas of the site that you might find interesting:
Gold pass membership
A small monthly fee will give members access to structured training materials together with any updates that I make to the course in the future. I expect that members will feedback information so that I can create new videos or clarify existing information. In addition members will receive the following benefits:
- Ongoing access to basic training materials. Additional videos and materials will be added to this course from time to time.
- Ongoing access to a new intermediate course including videos and training materials.
- Ability to request additional training materials or seek clarification of existing materials.
- A free download every quarter. Each quarter I will select a different program or tutorial program from the Markplex site and make it available for you to download at no additional cost.
- A 20% discount off any downloadable programs or tutorials on Markplex.com.
- An additional 10% discount off our programming rates (making a total discount of 20%).
- Preferential ability to make suggestions for future tutorials or programs.
- Premium access to new tutorials as they become available
Click here to find out more about Gold Pass membership.
Tutorial 13
Tutorial 13 uses some advanced techniques to try and find support and resistance lines based on past pivot points.
The following chart shows the program developed in the tutorial applied to a DAL chart:

To read more about the tutorial click here.
Tutorial 15
Tutorial 15 looks for sequential pivot points and compares their values to see if they are close to a Fibonacci ratio. If so, the program draws lines and text to indicate the Fib level and the percentage tolerance. An example can be see in the following chart:

To read tutorial 15 click here.
Tutorial 16
This step-by-step tutorial uses EasyLanguage’s built in candlestick pattern functions, drawing a character(s) on the chart when a candlestick pattern has occurred. The program also demonstrates the use of StopLoss and ProfitTarget functions, and finds stochastic crossovers to provide confirmation signals a user-defined number of bars after an initial ‘warning signal. The program could be modified to use a different pair of indicators.
More information about tutorial 16.
Tutorial 22
Tutorial 22 demonstrates the creation of a paintbar study to show where Candlestick patterns occur. It also shows how to add text to a chart, above or below the patterns. The tutorial also demonstrates how to add a stochastic ‘filter.’
To view more information, click here.
Tutorial 23
TradeStation provides a ‘three-line-break’ chart. This tutorial creates an indicator which overlays 3 line break information over a normal chart. It also plots an indicator line that is green when ‘up’ boxes are plotted and red when ‘down’ boxes are plotted.
To watch videos which explain the creation of this indicator, click here.
Tutorial 26
Tutorial 26 creates an improved stochastic-price divergence indicator. Divergence occurs, when, for example, price pivots make a higher high and the equivalent stochastic indicator makes a lower high.
This indicator recognizes that the pivot in the price and the assumed equivalent pivot in the stochastic don’t necessarily occur at the same exact bar. Consequently the program searches for equivalent pivots and uses them in determining whether a divergence has occurred.
To view video that explain the creation of this program, click here.
Tutorial 27
This video tutorial explains the creation of a pivot function that looks for pivots where the prices of successive bars on either side of the pivot are higher, or the highs of successive bars are lower.
To view video that explain the creation of this program, click here.
Tutorial 37
This tutorial follows on from tutorial 26 in that it looks for divergence between price and stochastic, but it is a show me study rather than an indicator.
To view tutorial 37 go here.
Program 1 – Fibonacci-confluence show-me study
This program is available for immediate download for $74.95 by clicking the ‘add to cart’ button below. You may pay using PayPal or a credit card.
Click here to see more detail.
 This program works by creating zig-zag lines (based on low and high pivots). Every time a zig-zag line is confirmed Fibonacci levels are calculated. These Fibonacci levels are compared with previous Fibonacci levels and if they are proximate the level stored in the array has its ‘thickness’ increased by one. The thickness attribute is used to indicate the significance of the level. More significant levels are drawn on the chart using a thicker line and only lines above a user input thickness are extended to the right.
Click here to see more detail and to download program 1
Program 2 – Pivot lines-confluence show-me study
This program is available for immediate download for $49.95 by clicking the ‘add to cart’ button below. You may pay using PayPal or a credit card.
Click here to see more detail.
 Program 2 calculates these pivot levels (using the classic method of calculation, the ‘Woodie’ levels, or the ‘Camarilla’ levels) it then seeks to find pivot levels that are close to those found previously on the chart (within a specified user input tolerance) and draws these levels on the chart.
The rationale behind the program is that if pivot levels have had real significance on a previous day then some of that influence could still be felt on the current day.
The image on the right shows the pivot based levels as green lines and today’s pivots as different colored lines with labels showing the type of pivot line (e.g. PP, R1, R2, S1, S2 etc) and its value. I created a ‘zoomed in ‘ effect in Photoshop so you can see these lines more clearly.
Click here to see more detail and to download program 2
Program 3 – Three line break show-me study
 This program is available for immediate download for $19.95 by clicking on the ‘add to cart’ button. You may pay with a credit card or by using PayPal.
Click here to see more detail.
This program takes the work done in tutorial 23 and converts it to a show me study. The functionality to draw the ‘quasi’ 3 line break boxes has been removed from the tutorial 23 program and showme dots are drawn at the start of, what would have been the green boxes and what would have been the red boxes on the tutorial 23 indicator.
Click here to see more detail.
Program 4 – Three line break pivot confluence
 Click here for more detailed information about program 4.
This program looks for turning points as they occur on a line break chart. Each newly discovered level is compared with levels already stored in an array. If the new level is close enough to an existing level, the two levels are combined. The number of times that each line is combined is also stored in the array. If the new level is not close to an existing level the new level is stored in the array.
This unprotected and commented program (i.e. the show me study) is available for immediate download for $49.95 by clicking the ‘add to cart’ button. You may with PayPal or a credit card.
Click here for more detailed information about program 4.
Program 5 – Line break strategy
 Click here for more details about program 5.
Program 5 takes the principles used in tutorial 23 and program 3 and builds them into a strategy. Instead of drawing a dot on the chart, as the ShowMe study does, the strategy issues a market order on the next bar after a new line break ‘line’ begins. The strategy includes several ‘template’ filters so that you can easily build filters into the program.
This unprotected and commented program (i.e. the TradeStation EasyLanguage strategy) is available for immediate download for $94.95 by clicking the following ‘add to cart’ button where you may pay with a credit card or by using PayPal.
The program was developed in TradeStation 8.7.
Program 6 – Pivot confluence strategy
Click here for more details about program 6
 Program 6 builds upon the work done in tutorial 13 to search for price pivots that may carry special significance. Having found such a pivot level of a certain ‘weighting,’ this program then enters trades based on a user defined filter and the number of ‘weighted’ pivots above and below the newly found pivot.
This unprotected and commented program (i.e. the TradeStation EasyLanguage strategy) is available for immediate download for $119.95 by clicking the ‘add to cart’ button. You can pay with credit card or PayPal.
The program was developed in TradeStation 8.7.
Program 7 – Configurable traders’ Pivots Indicator
Click here for more details about the traders’ pivot indicator (program 7)
 Program 7 provides a flexible way to define a session based on user input start and end times and calculates and adds to the chart Classic, Woodie, or Camarilla traders’ pivots based on the high, low, and close of the period defined by the user (and the open of the next period in the case of Woodie pivots). The type of pivot drawn on the chart depends on which type of pivot is selected by the user.
The start and end times can be on the same day, or the start can be on one day and the end on the next day. Plots of the high, low and close of the period being analyzed may be switched on or off using a user input.
This unprotected and commented program (i.e. the TradeStation EasyLanguage strategy) is available for immediate download for $49.95 by clicking the ‘add to cart’ button to pay using PayPal or credit card.
The program was developed in TradeStation 8.7 and works with intraday and tick charts.
Click here for more information about the traders’ pivot indicator (program 7)
Program 8 – Zig zag conflux
Click here to get more information about program 8 – Zig Zag Confluence

This unprotected and commented program (i.e. the TradeStation EasyLanguage indicator) and associated array sort function is available for immediate download for $69.95 by clicking the ‘add to cart’ button to pay using PayPal or credit card.
The program was developed in TradeStation 8.7 and works on intraday, daily, weekly, and monthly charts.
Program 9 – Smoothed and low-lag CCI indicator
Click here to get more information about program 9

This protected program (i.e. the TradeStation EasyLanguage indicator) is available for immediate download for $44.95 by clicking the ‘add to cart’ button to pay using credit card or PayPal. The program is also available for MultiCharts. Please select the version you need.
The program was developed in TradeStation 8.7 and works on intraday, daily, weekly, and monthly charts.
Program 10 – Smoothed and low-lag CCI indicator (enhanced)
Click here to get more information about program 10

- Allows user inputs for the color of the CCI line when above the UpperLine input (in this case, it is set to 100), or below the LowerLine input (in this case it is set to -100) and between the lines.
- Sets an alert when the UpperLine and LowerLine lines are crossed.
- In additional to the divergence functionality included in Program 9, program 10 looks for divergence between the two most recent smoothed CCI pivots, and the most recent price pivot and the pivot before the second most recent price pivot. I explain this is the video below.
This PROTECTED program (i.e. the TradeStation EasyLanguage indicator) is available for immediate download for $54.95. In addition, if you are a MultiCharts user, a ‘read only’ SEF version of the program is also available. Click the following ‘add to cart’ button to pay by credit card or PayPal. Make sure you select the correct version:
Program 11 – An enhanced smoothed, low-lag Commodity Channel Index (CCI) indicator – WITH ADDITIONAL FEATURES
Click here to get more information about program 11
Program 11 takes programs 9 and 10 and adds additional enhancements as follows:
- A new input that allows users to look for divergences between price and the smoothed fast CCI
- A new user input allows the user the option of drawing a line when there is a possible divergence. The line would then disappear if the divergence. were not confirmed when the bar closes.
- A new input allows user the ability to look for potential divergences faster.
Click here for more explanation of these new features.
This PROTECTED program (i.e. the Tradestation EasyLanguage indicator) is available for immediate download for $69.95. If you are a MultiCharts user, a ‘read only’ SEF version of the program is available. Click on the ‘add to cart’ button to pay using a credit card or PayPal
Bonus TradeStation Scanner video
If you buy the TradeStation version, I will also send you a link to a video that explains how you could use this program to scan a universe of stocks to see which ones the indicator has found possible divergence for using TradeStation Scanner.
Program 12 – Candlestick pattern strategy with user defined filters
Click here for more information about Program 12
Program 12 looks for CandleStick patterns to create possible trade signals. These signals are filtered by user defined filters before possible trades are entered.

This UNPROTECTED program (i.e. the TradeStation EasyLanguage strategy) is available for immediate download for $79.95 by clicking the ‘add to cart’ button to pay using Credit card or PayPal.
Program 13 – ‘Pivot-Limit’ strategy
Click here for more information on program 13

In the ‘short’ setup we look for a high pivot, for the price to dip down, then rise above the pivot level for a limit order to be placed next bar (you can also define filters to further restrict when a trade is placed.) The long setup requires a low pivot, followed by a lower low for a long limit order to be placed next bar (again, you can define filters to further restrict when trades are placed).
The unprotected (i.e. you can view and modify the EasyLanguage) program may be downloaded for $79.95 by clicking the following button. You may pay by credit card or PayPal.
Program 14 – Finding the times where price changes direction most often
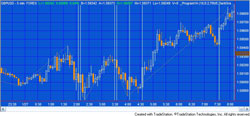
Program 14 analyzes an intraday chart to see if, over the time being analyzed, there are specific times when price action most frequently changes direction.
The unprotected program developed for TradeStation version 9.0 and version 8.7 are available for immediate download for $74.95. Click the following ‘add to cart’ button. You may pay with credit card or PayPal.
Program 14 is an EasyLanguage show me study developed in TradeStation version 9.0. It calculates zig zag patterns and stores the times at which the turning points occur in an array. Each time a new turning point is confirmed the time at which it occurred is compared with those already in the array. If the time is already in the array its ‘significance index’ is incremented by one.
Program 15 – Finding potential turning ‘zones’
Read more about program 15 here
Program 15 analyzes price action in terms of both time and potential support and resistance levels on intraday charts to try and find ‘zones’ where, historically, price turning points have occurred.

The unprotected program for version 8.7 and above is available for immediate download for $119.95. This price includes a copy of program 14 which is bundled in the download.
Program 16 – Support and resistance levels combined with time zones
Read more about program 16 here

Download the program here for $74.95.
Program 17 – Finding a conflux of traders’ pivots
More information, including a demonstration video, can be found about program 17, here.

This unprotected program (i.e. the TradeStation EasyLanguage indicator) is available for immediate download for an online payment of $74.95 by clicking the following button.
Program 18 – CCI divergence strategy (and smoothed CCI indicator)
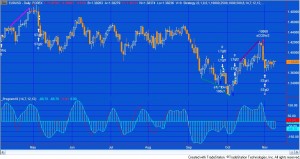
The program works in TradeStation versions 8.7, 8.8 and 9.0. I have commented the code. It has been tested it on intraday, daily, weekly and monthly charts for futures, stocks and forex.
Program 18 consists of an unprotected TradeStation EasyLanguage strategy together with a protected EasyLanguage function and a smoothed CCI indicator. The function calculates the smoothed Markplex CCI (using the calculation previously applied in programs 10 and 11) and it is called from both the strategy and the indicator. The strategy bases signals on divergence between the smoothed CCI and price.
Program 19 – Indicator to draw rectangle with alerts triggered when price crosses sides
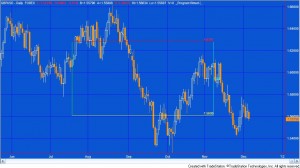
This unprotected indicator is available for immediate download by clicking below to pay using Credit Card or PayPal. The program works in TradeStation version 9.0. I have commented the code. It has been tested it on intraday, daily, weekly and monthly charts for futures, stocks and forex.
This program is available for immediate download for $95- by clicking the ‘add to cart’ button below. You may pay using PayPal or a credit card.
Program 20 – CCI trend break
For more information on program 20 click here.
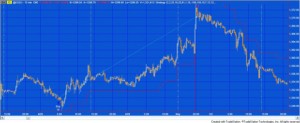
This unprotected strategy is available for immediate download. You may pay by Credit Card or PayPal. The program works in TradeStation version 9.0. I have commented the code. It has been tested it on intraday, daily, weekly and monthly charts for futures, stocks and forex.
This program is available for immediate download for $195- by clicking the ‘add to cart’ button below. You may pay using PayPal or a credit card.
Program 21 – Turning points show-me study
For more information on program 21 click here

To go directly to the TradeStation Strategy Network click here.
Program 22 – Configurable three line break indicator
For more information on program 22 click here
Program 22 | Configurable Three Line Break Indicator, adds to tutorial 23 by the introduction of an input which, if set to TRUE, resets the line break every day. I explain more in the video below. I have also added the following additional capabilities:
- An input which when set to true, turns off the ‘lines’ or boxes.
- An input to control the thickness of the lines (or boxes).
- An input to determine how many lines to include in the ‘break.’ The default being three (this one was already included in tutorial 23)
In addition, the ‘lines’ are represented by rectangles, as opposed to the segmented rectangles that were used in the earlier program.
This program is available for immediate download for $59.95- by clicking the ‘add to cart’ button below. You may pay using PayPal or a credit card.
Program 23 – Adaptive moving average
This TradeStation EasyLanguage showme study seeks to find these moving averages and then it ‘adapts’ its moving average length according to the length of the moving average that was close to the previous high or low pivot.
The program works by, at every new high or low pivot, calculating a range of moving averages (depending on the user inputs). It then compares these moving average values (starting with the slowest, i.e. the moving average with the longest length) and if it finds one within a user defined tolerance of the pivot, it begins plotting a moving average with that length.
This program is available for immediate download for $29.95- by clicking the ‘add to cart’ button below. You may pay using PayPal or a credit card.
Program 24 – Finding ‘reverse’ or ‘hidden’ divergence between price and a smoothed CCI
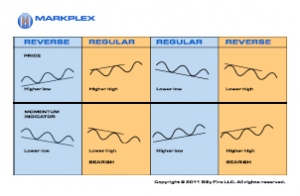
- An input that allows users to look for hidden divergences between price and the smoothed fast CCI
- A user input allows the user the option of drawing a line when there is a possible hidden divergence. The line disappears if the hidden divergence. were not confirmed when the bar closes.
- An input that means the program looks for potential hidden divergences consisting of two CCI pivots, an initial price pivot and then a price occurring on the same bar as the second CCI pivot that indicates a possible divergence. The second price ‘sampling’ does not necessarily need to be a price pivot. The idea is that it could possibly give the user early warning of a divergence, prior to the price pivot occurring
This UNPROTECTED TradeStation EasyLanguage indicator and a PROTECTED smoothed CCI function are available for immediate download for $69.95. The indicator is commented throughout. Click on the ‘add to cart’ button to pay using a credit card or PayPal.
The program was developed in TradeStation 9.0 and works on intraday, daily, weekly, and monthly charts.
You can also download a packaged bundle of programs 11 and 24 for a special discounted price of $119- (i.e. $20 off the regular price for both programs bought separately). Click on the ‘add to cart’ button to pay using a credit card or PayPal.
Program 25 – Candlestick finder
Click here for a full program description.
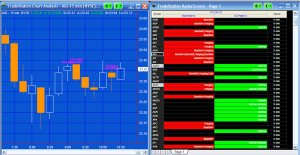
Program 25 is a show me study that searches for candlestick patterns on both charts and RadarScreen. You can determine whether to search for particular patterns by setting a user input. The program works in RadarScreen, where you have the option of seeing if a patterns has occurred on the current ‘bar’ or whether one has appeared within a user input number of bars. The program includes an optional Stochastic filter and you can also set Alerts. It includes a commentary capability in RadarScreen.
This UNPROTECTED program (i.e. the TradeStation EasyLanguage show me study) is available for immediate download for $59.95 by clicking the ‘add to cart’ button to pay using Credit card or PayPal. The download includes the unprotected functions used by the program: _CheckLastSeveral and _PatternCommentary.
The programs were developed in TradeStation 9.0 and work on intraday, daily, weekly, and monthly charts.
Program 26 – Zig zag repeated change
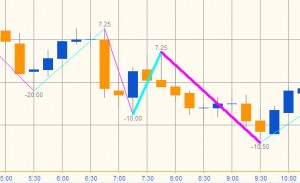
Program 26 is a TradeStation showme study created in TradeStation 9.0 that calculates zig-zag patterns and calculates the difference between each high and the next low, and the difference between each low and the next high. The values are ‘drawn’ on the chart to the appropriate number of decimal places. In addition, the program compares each downward zig zag with the previous downward zig zag. If the new downward zig zag is with a user defined tolerance of the previous downward zig zag, the thickness of the current downward zig zag is increased to a user defined value. Similarly, if the new upward zig zag is with a user defined tolerance of the previous upward zig zag, the thickness of the current upward zig zag is increased to a user defined value.
This UNPROTECTED program (i.e. the TradeStation EasyLanguage show me study) is available for immediate download for $59.95 by clicking the ‘add to cart’ button to pay using Credit card or PayPal.
The programs were developed in TradeStation 9.0 and work on intraday, daily, weekly, and monthly charts. The show me study may be applied to tick charts, but the pattern text may not display correctly due to an EasyLanguage drawing tool limitations.
If you are a Gold Pass member make sure you enter the special coupon code to get 20% discount off these prices.
Program 27 – MACD divergence for charts, scanner and RadarScreen
Program 27 is a TradeStation indicator that looks for regular divergence between price and a MACD indicator. Inputs allow the user to determine whether to use MACD, exponential average of MACD or the difference between the two. The program works by finding and storing price and the MACD pivots in an array. The pivots must occur within a user defined number of bars of each other. Once a new pivot pair is found is is compared with a user defined number of pivots (maximum 4 previous pivots) to check if positive or regular divergence has occurred. The program works on charts, RadarScreen and the TradeStation scanner.
Get more information about program 27 here.
This UNPROTECTED program (i.e. the TradeStation EasyLanguage indicator) is available for immediate download for $129.95 by clicking the ‘add to cart’ button to pay using Credit card or PayPal. The download includes a link to a bonus video that gives an overview of how the program functions.
The program was developed in TradeStation 9.0 and work on intraday, daily, weekly, and monthly charts. The show me study may be applied to tick charts, but the pattern text may not display correctly due to an EasyLanguage drawing tool limitations.
If you are a Gold Pass member make sure you enter the special coupon code to get 20% discount off these prices.
Program 28 – Stochastic divergence for charts, scanner and Radarscreen
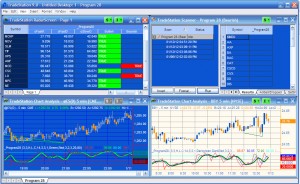
Program 28 is a TradeStation Indicator developed using EasyLanguage designed to look for potential divergences between price and a stochastic oscillator.
The program works on charts, RadarScreen and the TradeStation scanner. It was developed using TradeStation 9.0.
See more information about program 28 here.
Program 29 – Zig Zag turning point predictor using the vector class
Program 29 uses program 26 and adds additional functionality to attempt to predict future zig zag turning points.
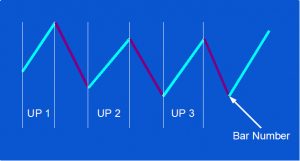
More information can be found about program 29 here.
Program 30 – TSI divergence
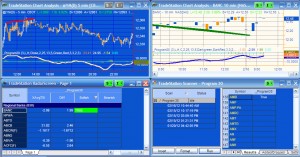
Program 30 looks for positive divergence between price and the True Strength Index (TSI). The download includes the unprotected program itself, with the following bonuses:
- a user guide in PDF format
- a video that describes how to easily modify the program to look for divergence between price and other oscillators (in the video I show how to convert the program to use RSI)
Program 30 works similarly to program 27 and program 28 which look for divergence between price and MACD and price and stochastics respectively. When a potential divergence is found, a line is drawn on the chart. The program also plots TSI, smoothed TSI and the difference between the two. More information, including a video, may be found here: //markplex.com/easylanguage-programs/program-30-true-strength-index-tsi-divergence/
This UNPROTECTED program (i.e. the TradeStation EasyLanguage indicator) is available for immediate download for $97.95 by clicking the ‘add to cart’ button to pay using Credit card or PayPal.
The download includes the following bonuses:
- a user guide in PDF format
- a video that explains how to modify the program to use a different indicator (e.g. RSI).
Please note that any screen shots on this site are examples and are not meant to imply that any of these programs will generate profitable trades. THESE INDICATORS, SHOW ME STUDIES, STRATEGIES AND OTHER PROGRAMS HAVE BEEN INCLUDED SOLELY FOR EDUCATIONAL PURPOSES.
TO THE BEST OF MARKPLEX CORPORATION’S KNOWLEDGE, ALL OF THE INFORMATION ON THIS PAGE IS CORRECT, AND IT IS PROVIDED IN THE HOPE THAT IT WILL BE USEFUL. HOWEVER, MARKPLEX CORPORATION ASSUMES NO LIABILITY FOR ANY DAMAGES, DIRECT OR OTHERWISE, RESULTING FROM THE USE OF THIS INFORMATION AND/OR PROGRAM(S) DESCRIBED, AND NO WARRANTY IS MADE REGARDING ITS ACCURACY OR COMPLETENESS. USE OF THIS INFORMATION AND/OR PROGRAMS DESCRIBED IS AT YOUR OWN RISK.
ANY EASYLANGUAGE OR POWERLANGUAGE TRADING STRATEGIES, SIGNALS, STUDIES, INDICATORS, SHOWME STUDIES, PAINTBAR STUDIES, PROBABILITYMAP STUDIES, ACTIVITYBAR STUDIES, FUNCTIONS (AND PARTS THEREOF) AND ASSOCIATED TECHNIQUES REFERRED TO, INCLUDED IN OR ATTACHED TO THIS TUTORIAL OR PROGRAM DESCRIPTION ARE EXAMPLES ONLY, AND HAVE BEEN INCLUDED SOLELY FOR EDUCATIONAL PURPOSES. MARKPLEX CORPORATION. DOES NOT RECOMMEND THAT YOU USE ANY SUCH TRADING STRATEGIES, SIGNALS, STUDIES, INDICATORS, SHOWME STUDIES, PAINTBAR STUDIES, PROBABILITYMAP STUDIES, ACTIVITYBAR STUDIES, FUNCTIONS (OR ANY PARTS THEREOF) OR TECHNIQUES. THE USE OF ANY SUCH TRADING STRATEGIES, SIGNALS, STUDIES, INDICATORS, SHOWME STUDIES, PAINTBAR STUDIES, PROBABILITYMAP STUDIES, ACTIVITYBAR STUDIES, FUNCTIONS AND TECHNIQUES DOES NOT GUARANTEE THAT YOU WILL MAKE PROFITS, INCREASE PROFITS, OR MINIMIZE LOSSES.

